
- It has been a fantastic call to be structurally long bond’s duration for close to 40 years as yields kept falling
- It has been less rewarding and more painful lately for the vast majority of bond’s investors as the fast repricing higher in rates has led to a collapse in existing bond’s prices
- Yesterday pain is tomorrow Eldorado on the fixed income universe. So, bonds are back now!
- But what’s next? Should you favor passive or active management? For several reasons explained here below, active management and selectivity should prevail over a passive approach.
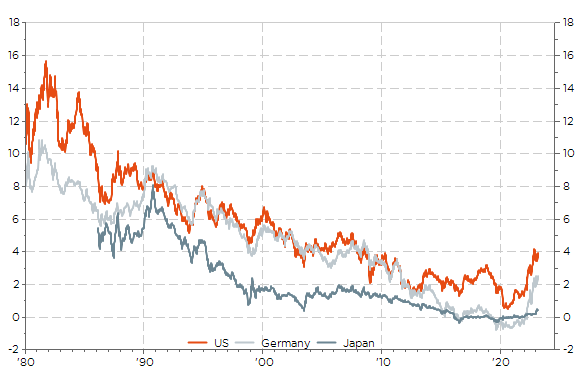
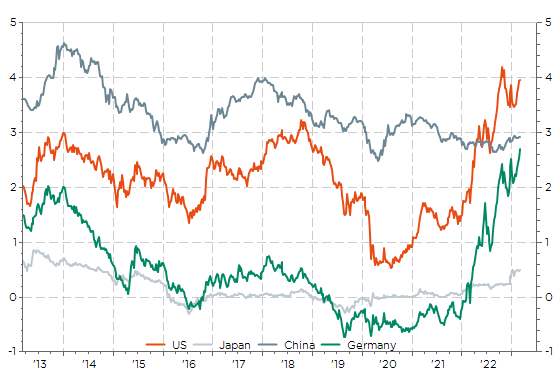
For close to 40 years until recently, it has been a fantastic call to be long bond’s duration, especially through passive ETF’s investment in order to keep duration constantly high. For sure, we experienced a secular bond bull market with US 10y yield falling from circa 16% at the beginning of the 80’s to a low of 0.5% in the summer 2020.
Selected 10y rates
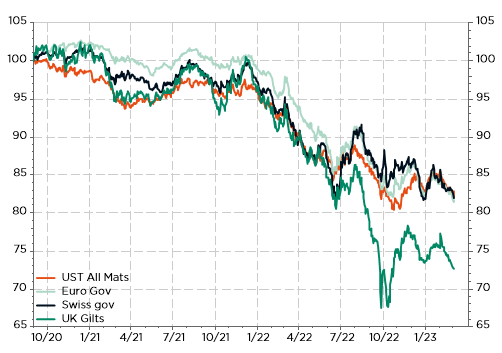
Since then, it has been less rewarding and more painful for the vast majority of bond’s investors as the fast repricing higher in rates has led to a collapse in existing bond’s prices. Credit exposure has helped to mitigate the impact of rising fast “risk-free” rate so far, but HY and leveraged loans could be the next in the line if the monetary policy tightening end in tears with a severe recession.
Selected government bonds total return since September 2021
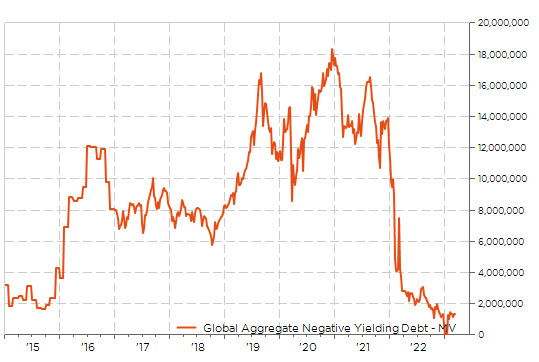
Yesterday pain (the bad news) is tomorrow Eldorado (the good news) as fixed income investors face again some decent positive yield in the large global DM bond’s universe. In other words, we went through a painful but necessary reset, propelling $18tn of negative yielding debt into positive territory over the last 2 years. The current leftovers, worth circa $1tn, are JGBs with short maturities.
Negative yielding debt market value
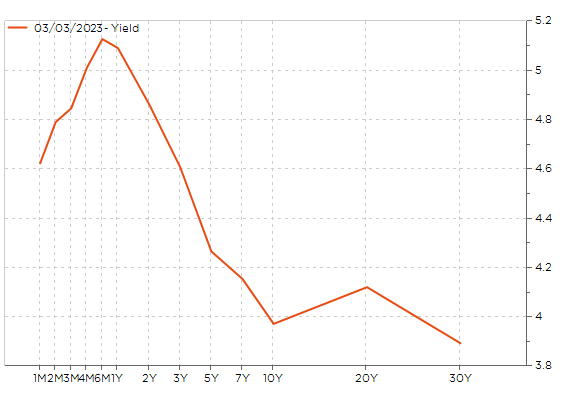
But what’s next? Should you favor passive or active management? I believe there is a strong case for the latter… especially if we are entering a prolonged increase in rates. Moreover, as the coupon or income portion will now represent again the lions share of the bonds’ total return AND the yield curve is currently inverted or flat in most DM, there are less rational reasons nowadays to be “structurally long duration” or play the roll-down (i.e. benefitting from a positive yield curve to clip price’s gain before the bonds mature) with passive funds.
Current US Yield Curve
Another potential ongoing change, or should I say backward step, compared to the last decade, concerns the (geographical) base currency diversification, which has been a forced trend for bond’s investors based in Japan for a very long time given the lack of yields on Japanese bonds, but also for investors based in Europe over the last 10 years, and also to a lesser extent or for shorter period for US ones. But today, what’s the point of investing passively in a global bond index with about 15% and 10% invested respectively in Japan government bonds (still yielding close to 0% and thus still at risk of significant losses going forward too) and in China sovereign bonds (they likely don’t offer a sufficient extra-yield to justify the risk). They may eventually bring some (limited) decorrelation but at the (too high) expense of future performances in my views.
Selected 10y rates over the last decade
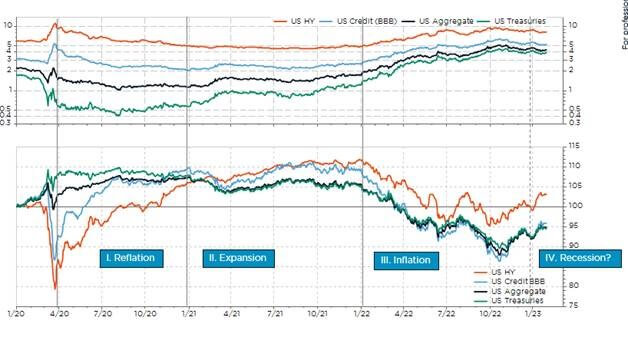
As said here above, HY credit exposure has helped to mitigate the impact of rising fast “risk-free” rate on the back of structurally higher coupons, shorter maturities and a credit spread, which has acted as a buffer so far (actually US High Yield total return is flattish over the last 18 months). The “nice thing” with bonds, assuming inflation is not a (severe enough) issue, is that you could theoretically make money in any situation… assuming you pick the right horses. Short duration & credit when the economy recovers & expands; long duration & top-rating liquid sovereign (UST, German Bund) when growth slows down & economy experiences a recession. The inflation’s issue we have been experiencing for more than a year now has somewhat distorted this rule of thumb as govies underperformed credit. In other words, the impact on “risk-free” rate from the inflation issue has overridden (so far?) the spreads widening from the contained (so far?) economic slowdown.
Credit or Govies: it depends where you are in the cycle. Comparing the average yield-to-maturity (chart on the top) and the total returns (chart on the bottom) for different USD indices (Treasuries, Credit and HY) since 2020
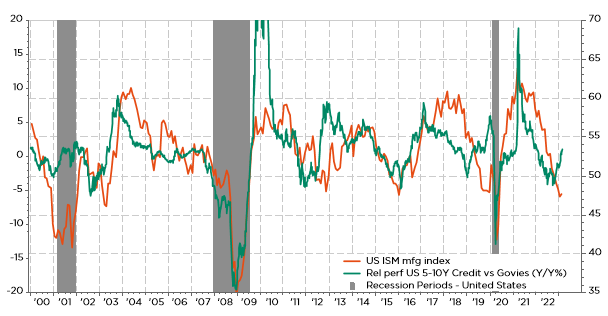
The one-trillion dollars’ question and latent risk for the next 6-18 months is: will we experience a severe recession combined with a sharp decrease in inflation? Or will the soft landing (or no-landing) and sticky inflation scenario still prevails in the foreseeable future? In the former case, (active) bond’s managers will certainly rush to exit credit and extend top-quality sovereign duration, while in the current macro backdrop, short-to-medium maturities with some exposure to credit, favoring the upper-end of the credit spectrum, will certainly do the trick by delivering a superior risk-adjusted returns.
Credit underperforms when growth slowdown (and inflation is low/falls)
In conclusion, if cautious (light-positioning) & passive was certainly the best way to invest in bonds in the last few years, it is now time to ramp-up your bonds exposure and be more selective.
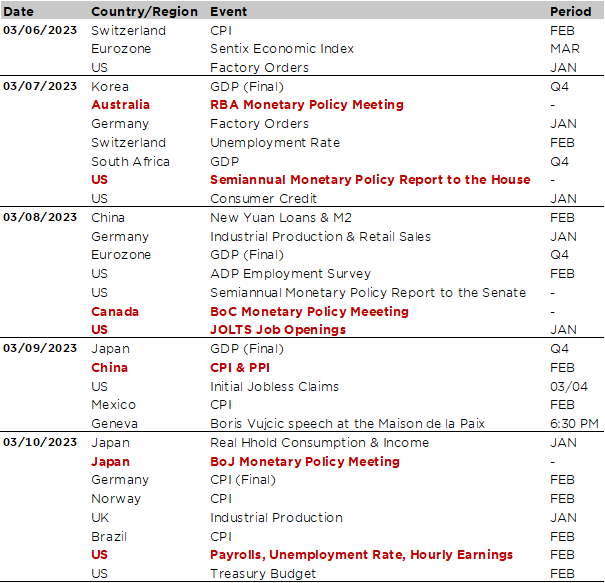
Economic calendar
It will be again a packed weekly calendar data this week along with some central banks’ meetings, Fed’s Powell’s semiannual monetary report and testimony before both the Senate and the House (tomorrow and Wednesday), as well as the ongoing China’s 14th National People’s Congress, which started yesterday with a damp squib given the modest 5% growth target for this year. However, the key highlight of the week will certainly be the February US jobs report on Friday as it will add new elements to the debate on US monetary policy future trajectory (how far and how fast the Fed will have to hike). The consensus expects the change in nonfarm payrolls to slow to about 200k-250k, down after a surprising reacceleration in January (+517k), while the unemployment rate should stay close to its 54-year lows of 3.4%. Average (and median) wages growth will also be scrutinized, as well as the participation rate to assess to what extent the Fed’s job is done (or not). Prior that, there will be other US labor market-related indicators to crunch this week, including the ADP report and JOLTS data on Wednesday and the weekly initial jobless claims on Thursday.
The ball of central banks’ meetings will also begin this week with the RBA meeting tomorrow (+25bps to 3.60% expected), the BoC -the day after- expected to stay on hold at 4.5% and finally the BoJ on Friday, which will be the last monetary policy meeting for Governor Kuroda. In this/his respect, the Japanese central bank will likely stick one more time to its current ultra-lose monetary policy, with YCC removal or even tweaks seen unlikely. Any material policy change in the BoJ’s policy framework should eventually come afterwards. Next week, we will then get the ECB (16 March), before closing the central banks’ ball the following week with the Fed (March 22), the BoE & SNB (March 23).
Other noticeable data include US and Germany factory orders for January (today and tomorrow), China M2 growth, New Loans & Total Social Financing figures for February (Wednesday), China CPI & PPI on Thursday and Japan real households consumption and income on Friday. Finally, for those based in Geneva, I would like to highlight the ICMB Public Conference that will take place at the Maison de la paix (Auditorium Ivan Pictet) this Thursday at 6:30 p.m. The guest speaker will be Boris Vujčić, Governor of the Croatian National Bank, who will give a conference on “Introducing the €uro in Times of Inflation: The Case of Croatia”.
This is a marketing communication issued by DECALIA SA. It is neither directed to, nor intended for distribution or use by, any person or entity who is a citizen or resident of or located in any locality, state, country or jurisdiction where such distribution, publication, availability or use would be contrary to law or regulation. The information and data presented in this document are not to be considered as an offer or invitation to buy or sell any securities or financial instruments nor to subscribe to any services. The information, opinions, estimates, calculations etc. contained in this document reflect a judgment at the original date of publication and are subject to change without notice. Investments in any securities or financial instruments may not be suitable for all recipients and may not be available in all countries. This document has been prepared without taking account of the objectives, financial situation or needs of any particular investor. Before entering into any transaction, investors should consider the suitability of the transaction to individual circumstances and objectives. Any investment or trading or other decision should only be made by the client after a thorough reading of the relevant product term sheet, subscription agreement, information memorandum, prospectus or other offering document relating to the issue of the securities or other financial instruments. Where a document makes reference to a specific research report, the document should not be read in isolation without consulting the full research report, which may be provided upon request.
Unless specifically mentioned, charts are created by DECALIA SA based on FactSet, Bloomberg or Refinitiv data.