
On the eve of the Swiss national holiday, and after devoting my last week letter to the merits and, more importantly, the setbacks of the major economies and their currencies, it seemed obvious that we should take a closer look at Switzerland, its economy, its currency and its market. I received indeed many questions lately about the latest “generalized” appreciation of the Swiss Franc over the last few weeks. It is in fact quite puzzling to observe a strong CHF concomitant to a rising stock markets and an overall improvement in economic sentiment. Markets aren’t really in a risk-off mode: the “bad” speculators betting on a break-up of the euro area or panicked investors rushing into no-more-negative-but-still- low-yielding Swiss government bonds are quite rare those days. So, what are the reasons behind the recent appreciation?
With this quite exhaustive graphical overview, I will demonstrate, if proof were needed, that the recent strength of the Swiss franc is neither extraordinary nor surprising in terms of its intrinsic qualities. Like all assets combining quality and growth, the Swiss franc follows the same trajectory and it is often perceived as “overvalued”, but as my fellow analysts and equity managers would say, quality and growth deserve a premium! Reflecting structurally sound economic and financial fundamentals that are too bright compared to other currencies, it is ultimately just the other side of a coin that shines far too brightly compared to other economies. In other words, the Swiss franc is like poor man’s gold (really think about it!) … and, despite the SNB’s claims to the contrary, this strength has little to do with mere chance or the “evil” speculators who buy Swiss francs, and just exacerbate its “natural” appreciation trend, in times of market stress or overall uncertainties.
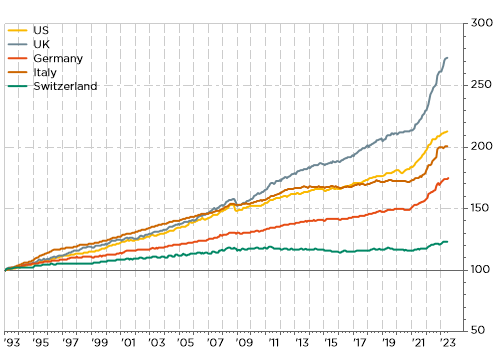
Economic growth: higher than European peers and more resilient than the USSelected Real GDP (rebased to 100 twenty years ago)

Inflation: greater price stability and less upward risks
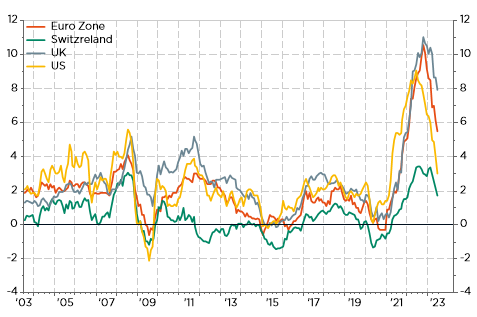
Selected CPI evolution over the last 30 years
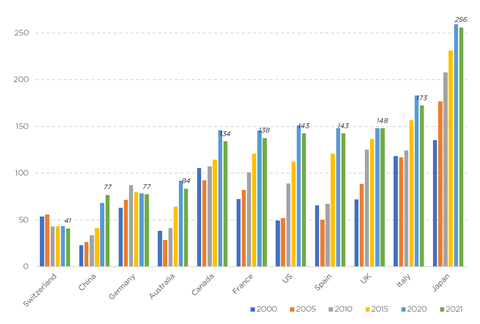
An unique favorable structural imbalance: a large current account surplus without any natural resources
To be fair, there’s one other economy also experiencing a large current account without any natural resources… Taiwan! As in the case of Switzerland, this creditor situation vis-à-vis the rest of the world is essentially linked to a surplus in the trade balance. Switzerland, like Taiwan, exports/produces more than it imports/consumes. While Switzerland’s trade surplus is mainly due to pharmaceuticals/chemicals industry, Taiwan’s surplus is largely due to its near-monopoly in semiconductor production. But that’s not all! Like Switzerland, Taiwan has a competitive, high value-added industry, a large pool of savings, a strong desire for political-economic-cultural independence but strong economic-cultural ties with much larger neighbors at the same time.
Swiss Current Account Breakdown over the last few quarters
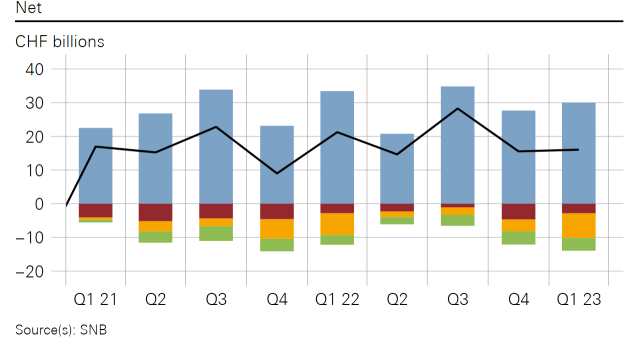
This large trade and current account surplus (close to 10% of GDP!) acts as a powerful CHF’s demand magnet on the forex market. In theory, it could be “resolved” only if CHF appreciates significantly enough to deter foreign demand for Swiss goods and exports but given the high degree of specialization in Swiss exports (i.e. the lack of alternatives) I am not convinced it will really work. Or else the Swiss franc would be so high that we’d no longer produce anything for our own consumption (we’d import everything). Government debt ceiling in Switzerland is another key reason behind the Swiss Franc strength. Like gold, Swiss Franc carries very little (government) debt behind… and thus it doesn’t offer either very high yield to compensate for that or inflation risk.
General Government Debt as a % of GDP: Ceiling, not sky, is the limit in Switzerland!
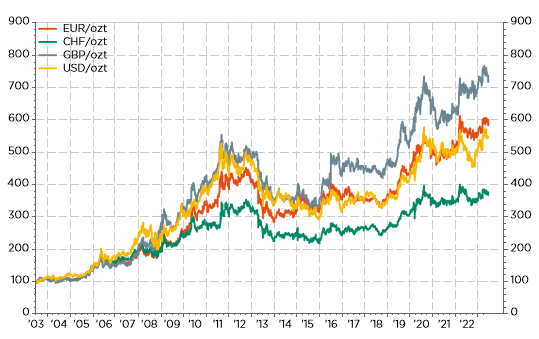
A stronger & more stable currency Selected currencies rebased on the price of gold (100 = 20y ago)
Another potential way to get a weaker CHF “in theory”, would be that Swiss based economic agents (government, consumers, companies) consume much more or save less, which according to me will be a more pragmatic and beneficial solution for the whole domestic economy. However, that’s essentially a political choice and we may then also accept to be less successful economically and financially speaking on certain metrics. In the meantime, we may just regret that the SNB hasn’t done more lobbying and explanations in that direction rather than to act as a desperate but useless Don Quichotte over the last decade.
It’s a bird, it’s a plane, nor it’s the SPI index: an outstanding equity market, which has even outperformed US equities since 2000
Swiss SPI (in $) vs. US S&P500 total return

Happy Swiss National Day!

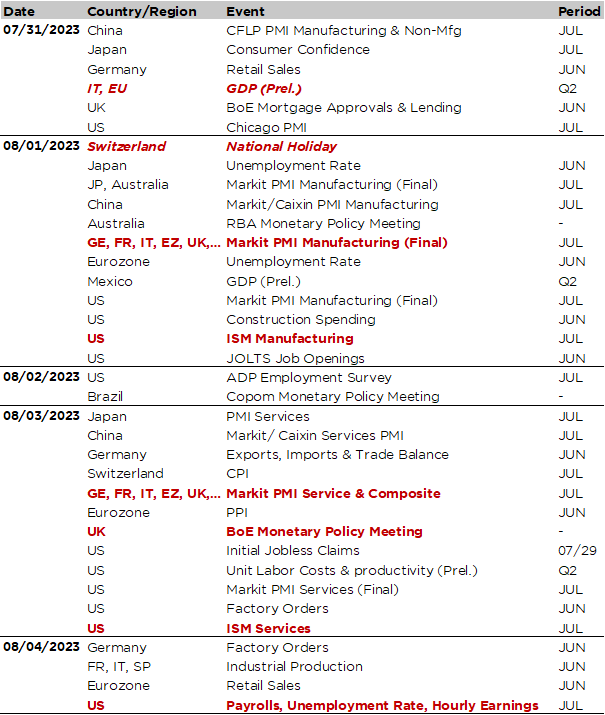
Economic Calendar
Another busily packed week is awaiting us in terms of economic agenda and companies’ earnings releases. The US labor market will take center stage with the July US job report on Friday as the key focus, preceded a few days before by the US JOLTS (tomorrow) and ADP (Wednesday) reports for June and July respectively. Signs of gradual labor market moderation are widely expected, but not outright weakness yet with payroll gains to slow below 200k in July (209k in June), unemployment rate remaining around 3.6% and average hourly earnings to slow marginally to +0.3% MoM, implying YoY wage growth to edge lower to 4.2%. While latest CPI prints have confirmed the ongoing disinflation progress, wages haven’t really yet been reassuring enough for the Fed to lower further its guard.
Otherwise, we will also get
- The US ISM indices for July, as well as the final readings of PMI indices across the globe, on Tuesday (manufacturing) and Thursday (services). According to our model, we expect the US ISM manufacturing index to rebound slightly towards 47-48 in July, while manufacturing weakness in the euro area should be confirmed (German PMI manufacturing index was below 40 according to the flash estimates). Despite some deceleration evidences, the services sector is expected to remain in expansion (ISM and PMI > 50) globally.
- Central banks meetings with the RBA (tomorrow), Brazil (Wednesday) and BoE (Thursday). While the jury is still out between a +25bps (on the back of the latest reassuring CPI print) or a +50bps hike to 5.5% considering the previous series of higher than expected inflation readings and still exceptionally high annual inflation experienced in the UK (headline at 7.9% and core at 6.9% in June), there shouldn’t be any surprise with the RBA where a moderate +25bps to 4.35% is widely expected as inflationary pressures aren’t so acute there. Finally, note that the central bank of Brazil may already initiate its easing cycle this week with a cut of -25bps to 13.5% for the Selic rate.
- Q2 GDP preliminary readings for the Euro Area & Italy today (weak, but positive growth is expected, outperforming marginally a stagnant German economy) and Mexico tomorrow and already a July CPI print for Switzerland on Thursday. Swiss annual inflation will likely remain just below 2% (1.7% in June) with some divergences among components.
As far as Q2 earnings season is concerned, it’s halftime with about half of the S&P 500 companies having already reported their results. The pace of earnings results will remain elevated this week before starting to cool down. In this context, Apple and Amazon will steal the show on Thursday. On top of other big Tech companies such as AMD, Qualcomm or Shopify, other sectors will also be under the spotlights such as Healthcare (Merck, Pfizer, Moderna), Consumers staples (Starbucks, AB InBev, Kraft Heinz), Auto-makers (Toyota, Ferrari, BMW) or Energy (BP, Occidental, ConocoPhillips) among others.
Non-exhaustive list of major 2023-Q2 earnings releases over the week

This is a marketing communication issued by DECALIA SA. It is neither directed to, nor intended for distribution or use by, any person or entity who is a citizen or resident of or located in any locality, state, country or jurisdiction where such distribution, publication, availability or use would be contrary to law or regulation. The information and data presented in this document are not to be considered as an offer or invitation to buy or sell any securities or financial instruments nor to subscribe to any services. The information, opinions, estimates, calculations etc. contained in this document reflect a judgment at the original date of publication and are subject to change without notice. Investments in any securities or financial instruments may not be suitable for all recipients and may not be available in all countries. This document has been prepared without taking account of the objectives, financial situation or needs of any particular investor. Before entering into any transaction, investors should consider the suitability of the transaction to individual circumstances and objectives. Any investment or trading or other decision should only be made by the client after a thorough reading of the relevant product term sheet, subscription agreement, information memorandum, prospectus or other offering document relating to the issue of the securities or other financial instruments. Where a document makes reference to a specific research report, the document should not be read in isolation without consulting the full research report, which may be provided upon request.
Unless specifically mentioned, charts are created by DECALIA SA based on FactSet, Bloomberg or Refinitiv data.