
After the Barbie movie, it’s time for the Teenage Mutant Ninja Turtles to hit the big screen with their “Cowabunga” rallying cry, which by the way may also mean astonishment or stupor; has been adopted by surfers as a declaration of enthusiasm or exhilaration; or can be used for a battle cry. So, in the same vein, the bond vigilantes are also back with a “Cowabunga” vengeance on your Bloomberg screen as US long rates have spiked above 4% last week after the unexpected downgrade of US sovereign credit rating to AA+ by Fitch. While I remain convinced that it’s too early to add meaningfully to duration risk, I believe this announcement has played a symbolic role rather than a fundamental one in last week’s sell-off. Here are the fundamental reasons -according to me- why US, but also other government bonds, long term rates could continue to grind higher, or at least remain structurally higher than in the last two decades.
Let’s be serious, “unexpected” was purely the timing of announcement, given the trajectory and projections of US government deficit and debt, underlined once again by the CBO (Congressional Budget Office, a nonpartisan organization producing independent analyses of budgetary and economic issues to support the Congressional budget process) in its June report, as well as the recurring debt ceiling issues. So, the impact of Fitch’s downgrade was not really meaningful as (1) bond’s managers were well aware of the incoming tsunami of UST issuances and (2) the grass isn’t any greener elsewhere (i.e. there really aren’t any better alternatives). In other words, it’s like if the scale of the liquid sovereign credit rating went from 1 to 10 to… 1 to 9. Analysis upsets but comparison comforts, as the saying goes (inspired by Talleyrand wise words: “Quand je me regarde je me désole, quand je me compare je me console”).
Make America AAA again! Total Deficit, Primary Deficit, and Net Interest Outlays (as % GDP)
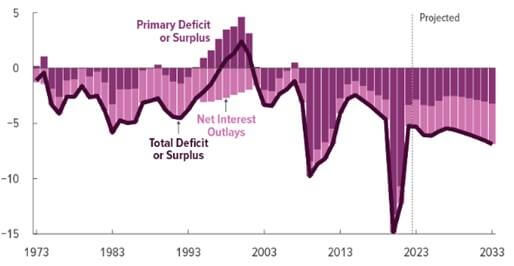
As a result of the CBO projections, the US federal debt is projected to rise from 98% in 2023 to 118% in 2033 as the growth of interest costs and mandatory spending will outpace the growth of revenues and the economy, driving up debt over this period. The increase in government deficits and debts will tend to require higher rates and compared to the previous decade, fiscal policy is clearly getting looser. Not only in the US but also in the euro area where the word “austerity” has been replaced by “whatever it costs” on the back of the pandemics, the energy transition and the war in Ukraine. However, it’s only one part of the equation (namely the supply) as rising public debt didn’t impede long rates to trend lower in the past. In this sense, the Fitch downgrade signals perhaps we are crossing the Rubicon.
So, let’s now have a look at the demand for government bonds. Here things have really changed meaningfully over the last few months… Think about it!
- No more QE from the major central banks (and even gradual ongoing QT)
- Less needs nowadays for commercial banks to buy large amounts of government bonds to build High-Quality Liquid Assets portfolios as it was the case after the GFC on the back of tighter Basel III regulation & requirements (balance sheet buffer have now been built and large enough)
- Likely also less buying from life insurers as baby boomers are retiring… on top of spending their accumulated wealth more or less quickly. Even China is getting older and growing less faster and thus likely to accumulate less wealth that will be recycled partially in sovereign bonds going forward (do you remember Bernanke’s savings glut explanations for lower US long rates?)
- The BoJ abandoning gradually its Yield Curve Control. The anchor of global rates is being removed as Japanese investors will now return to their domestic market and thus rely less on foreign bonds
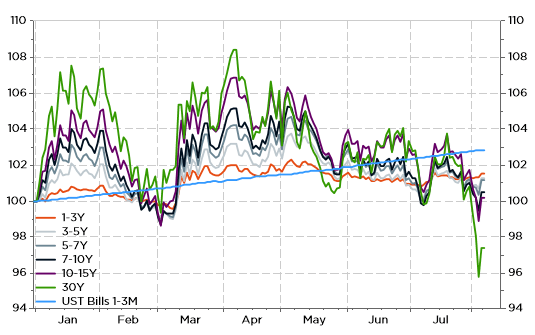
Then, on a more short-term fundamental basis, investors’ concerns about an incoming recession have dissipated (last week was another good one for the soft landing story). So, forget about a Fed’s pivot soon. And with energy and soft commodities prices rebounding lately, the recession tail risks are swinging back into a higher inflation and rates for longer. As a result, cash and monetary instruments (top quality bonds with less than 12 months maturity) have so far offered a better risk-adjusted returns than long term bonds, outperforming them with much less volatility.
UST total returns by maturity buckets: short duration has outperformed long duration so far this year
As I said several times over the last few months: with an already inverted yield curve, what’s the point to take excessive duration risks if you don’t expect a severe recession and/or an ongoing disinflation trend which will bring “easily” inflation back to central banks’ target? As long as there isn’t a convincing rationale (i.e. a crash in nominal GDP growth leading to a massive jump in unemployment rate) to go overly long in duration, cash may continue to offer the best risk-adjusted returns within most DM fixed income universes.
While I thus still consider it’s too early to add meaningfully to duration (i.e. I prefer to remain underweight), because I doubt about the buffer benefits of sovereign debt duration within balanced portfolios in a context of sticky inflation, hawkish hold monetary policy stance and loose fiscal policy, I must admit that long term bonds valuations have now also improved somewhat. In fact, according to the Gundlach’s model (Jeffrey Gundlach is the CEO and CIO of DoubleLine Capital, also known as the new Bond King when Bill Gross was retiring) signals that US 10y rates are at a spitting distance of fair value…
Gundlach model: UST 10y yield = 50% * US nominal growth + 50* German Bund 10y yield
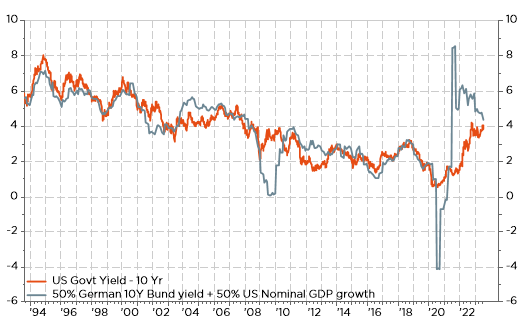
At this point, it’s worth mentioning a few caveats. First, fair value doesn’t mean undervalued. Then, the Gundlach model is purely … a very simple theoretical model, with real life observed UST 10y yield obviously over or undershooting its theoretical fair value. However, like a dog on a leash, it tends to remain close and return often to its fair value. Last but not least, while I remain underweight duration, I still have some exposure within the portfolios and funds I manage. It is just a contained exposure (clearly lower than in the past or compared to usual benchmarks). Recession risks in the foreseeable future are low but still latent and they may consequently rise rapidly too (look what happened when SVB collapsed and US regional banks were on the spotlight). So, even if you buy the higher rates secular trend story, bear in mind that there will always be a bid for duration: it just depends on the price or the “cyclical” context. Bear market rally is not the apanage of equity markets!
Anyway, one thing is for sure: we won’t get bored anymore managing fixed income portfolios given the ongoing structural and cyclical challenges, the decent yields we are experiencing again and the tsunami government debt we are facing. Add to that a wall of corporate debt to refinance after 2024 and we may just feel the exhilaration of a seasoned surfer in front of a great wave: Cowabunga!
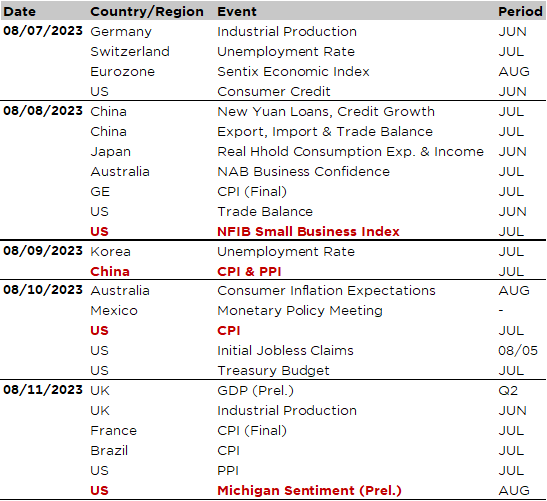
Economic Calendar
The release of the US July inflation report on Thursday will undoubtedly be the key macro event of the week. Both the core and headline CPI are expected to remain at 0.2% MoM in July, maintaining a contained run rate after stepping already lower the prior month. However, it shouldn’t lead to a significant decline of the core inflation YoY reading (4.8% in June) and, on the other hand, as far as the headline CPI is concerned, unfavorable base effects are likely to lead headline inflation higher actually, to 3.3% YoY in July from 3.0% the prior month. One thing to bear in mind for headline inflation over the next few months is the large gain in energy prices last month. Staying with prices, the US July PPI will be released on Friday, while both CPI and PPI July readings for China, which sits on the brink of deflation contrary to most economies, will hit the screen on Wednesday.
Note also that Brazil July inflation will be released on Friday: it is currently running at 3.2% and it is expected to remain with its tolerance margin (3% + or – 1.5%) tis year and next, while consumers inflation expectations are also behaving well (below 5%) and budget/fiscal policies uncertainties -after last year elections- have declined lately. As a result, the Brazil central bank has been among the first to cut rates at the end of July… from 13.75% to 13.25%, still offering a more than decent 8% real yield on cash, which should make some savers dream or frighten most borrowers in developed economies.
Otherwise, we will also get some economic activity & sentiment indicators to assess if growth is rather heading North or South. Starting with the US, the focus will be on the NFIB Small Business Index (tomorrow) and University of Michigan Consumer Sentiment preliminary reading for this month (on Friday). Other noticeable US data releases include weekly initial jobless claims, as a timely gauge of US labor market’s health, and the US treasury budget on Thursday. Usually, nobody pays attention to it but given last week events reminding the perhaps-not-so-good old days when bond vigilantes still had their say, it may be worth to keep an eye on.
In Europe, investors’ attention will turn on UK Q2 GDP preliminary reading (Friday), as well as the Germany industrial production (today) in order to confirm, or not, the surprise increase in factory orders according to last Friday’s release. Perhaps the sick man of Europe isn’t so sick after all. In Japan, action will be concentrated on Tuesday with several economic data releases, including households’ real income and consumption expenditures, on top of wages: these are key variables for BoJ to assess if inflation and growth are sustainably strong enough to make another path soon on the monetary policy normalization way.
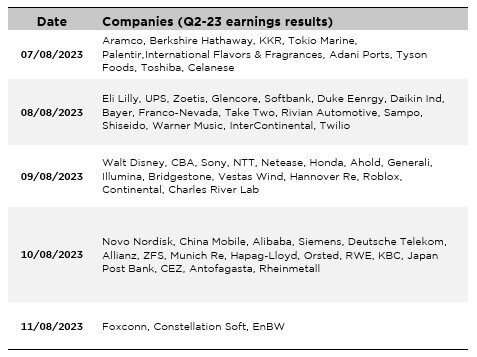
To conclude with the corporate earnings releases, there will still be a few well-known and big enough names reporting, such as Walt Disney, Berkshire Hathaway – released during the week-end- UPS or Eli-Lilly. Outside the US, the heavy-weights will be Aramco, Glencore, Softbank, Sony, NTT, Novo Nordisk, Alibaba, Siemens or Allianz among others.
Non-exhaustive list of major 2023-Q2 earnings releases over the week
This is a marketing communication issued by DECALIA SA. It is neither directed to, nor intended for distribution or use by, any person or entity who is a citizen or resident of or located in any locality, state, country or jurisdiction where such distribution, publication, availability or use would be contrary to law or regulation. The information and data presented in this document are not to be considered as an offer or invitation to buy or sell any securities or financial instruments nor to subscribe to any services. The information, opinions, estimates, calculations etc. contained in this document reflect a judgment at the original date of publication and are subject to change without notice. Investments in any securities or financial instruments may not be suitable for all recipients and may not be available in all countries. This document has been prepared without taking account of the objectives, financial situation or needs of any particular investor. Before entering into any transaction, investors should consider the suitability of the transaction to individual circumstances and objectives. Any investment or trading or other decision should only be made by the client after a thorough reading of the relevant product term sheet, subscription agreement, information memorandum, prospectus or other offering document relating to the issue of the securities or other financial instruments. Where a document makes reference to a specific research report, the document should not be read in isolation without consulting the full research report, which may be provided upon request.
Unless specifically mentioned, charts are created by DECALIA SA based on FactSet, Bloomberg or Refinitiv data.