
Over the past few weeks, I have tried to show that US financial conditions may not be as restrictive as one might think, given the Fed’s swift rate hike since March 2022 (from 0.25% to 5.5% in 18 months). As a result, the US economy has proved much more resilient than expected so far. Among the various reasons that may explain the overall too pessimistic views on growth, as well as on risk-on assets, that prevailed at the beginning of the year, is the fact that the vast majority of investors (myself included, but also central bankers I believe) applied the same playbook as usual, ignoring or underestimating certain major changes we have undergone or are undergoing.
First of all, many aspects of the economy are still being buffeted by the ripples from the pandemic, such as the divergence between manufacturing and services business cycles (services activity is now slowing down after experiencing a booming catch-up as travel restrictions were lifted, while manufacturing has now digested the excessive inventories built-up on the back of the short-lived spike in demand for goods when demand in services was inexistent) or the lasting impact of too accommodative economic policies, with the rearview mirror insights (such as the excess saving accumulated by US households). Therefore, it makes precedents hard to apply. Another key difference not immediately perceived or detected is the jump in inflation, if not perhaps even a change in regime. We’re so used to looking at variables in terms of annual variations and real terms that most of us didn’t immediately realized that something had perhaps changed compared to the last decades. This doesn’t necessarily mean that the transmission of monetary policy to the economy is no longer working, but simply that it has been hampered or delayed by exceptional events, making it harder to adjust.
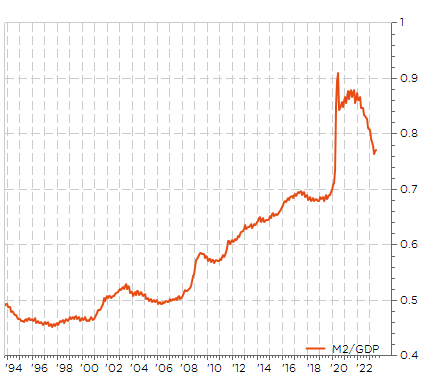
Let’s take an example among others to illustrate my point: despite M2 yoy growth has moved into negative territory since the end of last year (usually a sign that bad things such as a recession related to credit contraction will happen soon), the excess money supply injected during pandemic hasn’t yet been completely soaked as illustrated in the graph here below.
US M2/GDP: excess money supply hasn’t yet been completely soaked
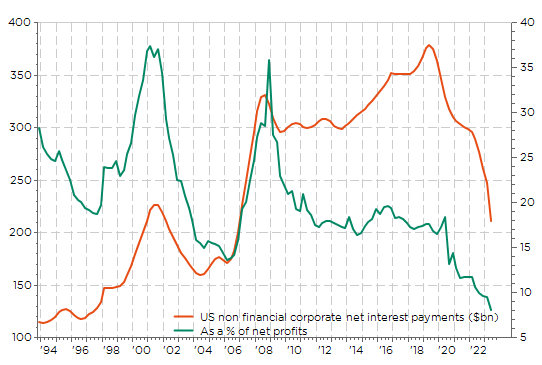
Another counterintuitive example that higher rates aren’t hurting much (yet) companies overall is given on the following chart, which shows that the net interest payment of non-financial companies has actually decreased over the last few quarters…, representing about 8% of net profits as of June 2023 compared to about 15-20% in the prior decade (2010-2020). That’s because the vast majority of investment grade companies were able to term out their debt at extremely favorable conditions, especially during the pandemic, while, in the meantime, those who are net cash benefit from higher cash yield. For sure, higher rates are certainly hurting more or will hurt sooner SMEs, which haven’t access to the same financial conditions in terms of rates and maturity than large cap in public markets, or overleveraged companies with weaker balance sheet.
Higher rates don’t even hurt (yet)!
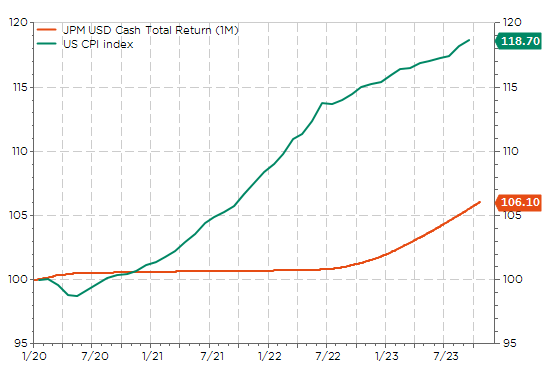
Last but not least, the sharp jump in CPI has also fooled many of us in the sense that while we may be satisfied with a return towards an annual inflation rate closer to the central bank target (US inflation is currently running around 4% depending on the gauge you look at), we are missing its cumulative impact… I mean inflation started with a bang from the beginning of 2021 (at a time when policy rates were nil until March 2022) and it is just slowing down now, but not declining… In the meantime, the cumulative impact of policy rates is just starting to catch-up and thus potentially kicking in. So, I may pretend that the cumulative impact of monetary policy over the last 3 years remains very accommodative…
USD 1M cash return vs US CPI rebased to 100 since 2020: catch me if you can!
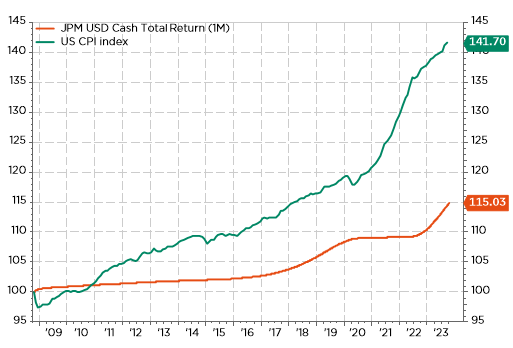
Worse! Using the same basic yardstick (cumulative inflation vs cash return), the financial repression over the last 3 years may have been ever more important than during the previous decade… of both low rates and inflation.
USD 1M cash return vs US CPI… Over the last 15 years
In other words, the first impact of higher inflation (first) and then higher rates (lagging behind) has likely been favourable so far for most economic agents, as their debt has been meaningfully eroded by inflation, while the restrictive impact of higher rates takes more time than usual, especially if they don’t face immediate large refinancing needs. To conclude, I leave the last words to Jay Powell, who said last week during an appearance before the Economic Club of New York: “Does it feel like policy is too tight right now? I would have to say no.” Bottom-line: be ready for higher for longer policy rates… until something breaks. Later.
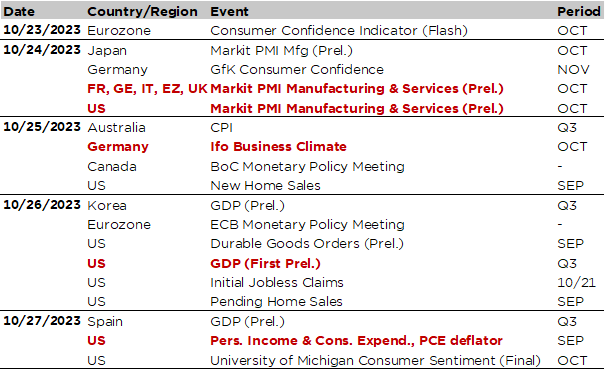
Economic Calendar
On top of Q3 earnings results season gathering full speed, there will be various key macro releases that will hit investors screen this week, starting with the global flash PMI indices on Tuesday, the preliminary US Q3 GDP report and the ECB meeting on Thursday, as well as the US PCE deflator for September on Friday.
As far as the global picture is concerned, the flash October PMI indices due tomorrow will bring more insights about the regional growth divergences experienced over the last few months between the resilience of US activity in both the manufacturing and services sector on one hand, the soft patch/recession in Europe on the other hand, or the disappointing muddling through trajectory of the Chinese economy. In this context, keep an eye on the sick man: Germany manufacturing PMI, which has remained below 40 for three consecutive months, for tentative signs of bottoming out… or not.
Staying in Europe and speaking about Germany business cycle, we will get the IFO index for October the following day (on Wednesday), which was close to last year lows last month. However, the key event will be the ECB decision on Thursday: consensus expects the central bank to keep rates unchanged at 4% with a “hawkish hold” tone concerning medium-term inflation risks, but a few dovish notes on the back of an uncertain growth outlook dominated by downside risks. So, investors will try to guess, through Lagarde’s conference press, how long ECB could keep rates at current levels and what could be the key triggers of the next move… up if inflation surprises on the upside, or down if growth falls further.
Turning to the US, the release of US Q3 GDP preliminary print on Thursday will be the main highlight. The consensus expects +4.3% annualized rate real growth last quarter after +2.1% in Q2, whilst the latest reading of Atlanta Fed GDPNow points to a reading of… +5.4%. Anyway, it seems that Q3 ended with a bang given the strong September figures we got for retail sales, industrial production or payrolls. The key question is: will increasing optimism about the US growth trajectory be confirmed? Or will a disappointing headline GDP deliver a cold shower to the consensus? Latest data and our own analysis favor the former optimistic assumption but we can’t rule out the latter bleaker one given the volatile inventories and net trade heavyweight components, which may drag down the overall headline reading. The next day, September personal income and spending data as well as the saving rate and the PCE deflator (both headline and core) will be released. The consensus expects both income and spending to have increased by about +0.4% to +0.5% last month, similar pace than the prior month, while core PCE deflator (Fed’s favorite inflation gauge) yoy change should moderate further from 3.9% to 3.7%, with a monthly increase of +0.3%. Other notable US economic releases include August new home sales (tomorrow), September durable goods orders (Wednesday) as well as weekly initial jobless claims (Thursday), which continue to be surprisingly low (they went below 200k last week!?) consistent with a rather tight labor market.
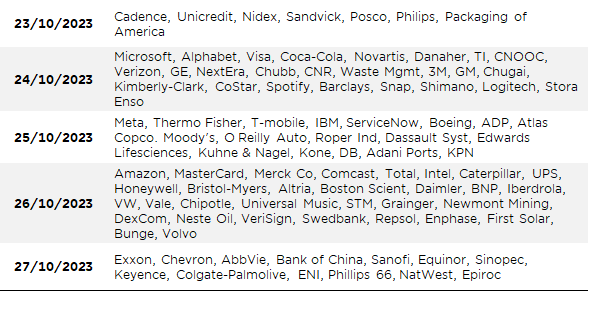
Moving on to Asia, the key events include the Australia CPI for Q3 (tomorrow) and preliminary reading of Q3 GDP in Korea (Thursday). Elsewhere, the Bank of Canada will also meet on Wednesday (consensus expects the BoC to keep policy rates unchanged at 5.0%). Finally, the Q3 earnings reporting season will gather full speed with the focus on big tech firms (Microsoft, Alphabet, Meta, Amazon) as well as major oil (Exxon Mobil, Chevron, Total, Equinor, ENI), healthcare (Merck, Novartis, Sanofi) or automakers companies (GM, Ford, Porsche, Mercedez-Benz and VW) among many others.
Non-exhaustive list of 2023-Q3 major earnings releases over the week
This is a marketing communication issued by DECALIA SA. It is neither directed to, nor intended for distribution or use by, any person or entity who is a citizen or resident of or located in any locality, state, country or jurisdiction where such distribution, publication, availability or use would be contrary to law or regulation. The information and data presented in this document are not to be considered as an offer or invitation to buy or sell any securities or financial instruments nor to subscribe to any services. The information, opinions, estimates, calculations etc. contained in this document reflect a judgment at the original date of publication and are subject to change without notice. Investments in any securities or financial instruments may not be suitable for all recipients and may not be available in all countries. This document has been prepared without taking account of the objectives, financial situation or needs of any particular investor. Before entering into any transaction, investors should consider the suitability of the transaction to individual circumstances and objectives. Any investment or trading or other decision should only be made by the client after a thorough reading of the relevant product term sheet, subscription agreement, information memorandum, prospectus or other offering document relating to the issue of the securities or other financial instruments. Where a document makes reference to a specific research report, the document should not be read in isolation without consulting the full research report, which may be provided upon request.
Unless specifically mentioned, charts are created by DECALIA SA based on FactSet, Bloomberg or Refinitiv data.