
Against all expectations, the Cagliari Calcio was able to draw with Inter yesterday evening and take home a valuable point from their trip to Milan in the race to stay in Serie A. Speaking about surprising result, valuable stuff and a golden sun symbol of light and life for my favorite soccer team, gold seems the natural choice as the subject at hand today. In fact, despite higher US (real) rates, falling global inflation (even if somewhat sticky in the US) and a stronger USD, gold price has soared further lately… For sure, its recent spike wasn’t driven by the usual macro suspects! If the near-term drivers of the current gold rally remain obscure (momentum has likely helped to some extent), the favorable “alignment of planets” backdrop supporting the bullish investment case remains intact.
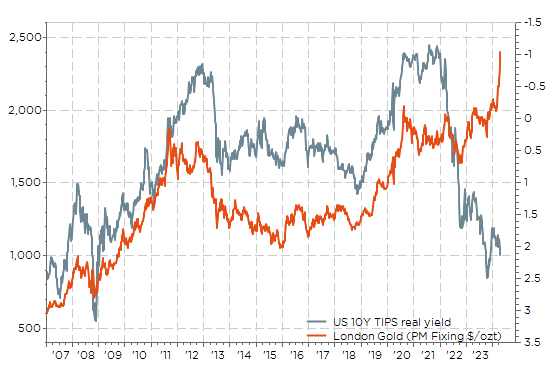
For the last two decades, the correlation between gold and real rate had worked in reverse: gold was up/down, when US real rates were down/up as illustrated in the graph here below. However, it’s obvious that something has changed since mid-2022: US real rates have continued creeping higher from +0.5% to more than 2% (right-hand inverted scale) as well gold, which has risen from about $1’700 to circa $2’400.
Gold price & US real interest rates: something is different this time
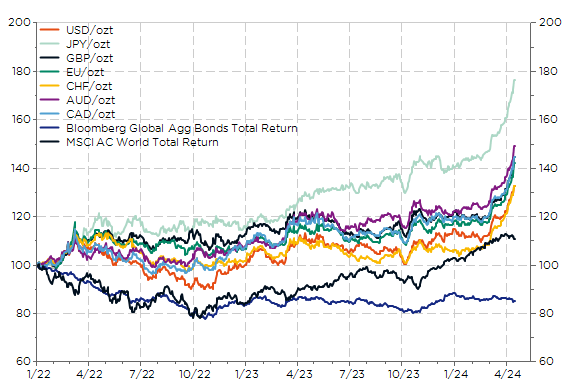
More interestingly, it has done a fantastic job in balanced portfolios since 2022 when you compare its performance – measured in your own base currency – in vs. global bonds, or even vs. global equities. For non-USD based investors, there is no doubt gold has clearly outperformed their respective bond markets, especially over the last 12 months despite falling inflation.
So, the first question is why gold rally has extended further this year. Inflation is perhaps not completely under control (higher oil prices are pushing US inflation expectations up), or investors are now doubting about central bank’s credibility/ability to bring inflation down to their 2% inflation target (many investors think the Fed will soon adopt a 3% target, more or less explicitly), or the barbaric relic has benefitted from the mounting concerns about the geopolitical/socio-economic fragmentation, or perhaps something else, even worse, is brewing… namely a mistrust towards US Treasuries and government bonds overall, especially as the “purest” or “best” safe haven asset.
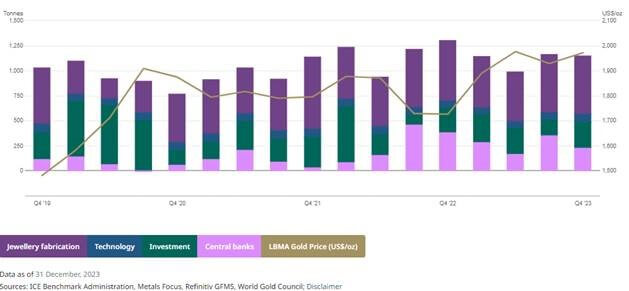
On the current physical demand side, as Christopher Wood from Jefferies notes in its latest “Greed & Fear” letter, we haven’t observed any inflows into gold ETFs in the Western World (quite the contrary in fact as, since April 2022, they have decreased from 3’300 to 2’600 tons), there is no physical premium on gold bars and coins traded in free market places and gold mining stocks are not really outperforming bullion over the last 2 years or year-to-date (even if they finally sky-rocketed since late February). However, I don’t think it’s a pure coincidence if the rebound of gold prices in April 2022… coincided with the Ukraine’s invasion by Russia (and the subsequent seizure and confiscation of assets hold by wealthy Russians by Western authorities) leading also just thereafter to a visible increase in gold demand from (non-Western) central banks as illustrated in the statistics of World Gold Council here below (data and graph as well as other useful research material is available freely but you need to register first).
Gold’s demand breakdown since 2019-Q4: central banks demand has been higher since 2022-Q3 compared to the prior years
More recently, still according to Christopher Wood, the most plausible explanation remains demand from China retail investors as highlighted by some anectodical evidences (an ETF investing in gold shares was suspended last week after it reached more than a 30% premium over its underlying assets…). They are plenty reasons to support this thesis: an eroding confidence in the Party, a more challenging economic outlook compared to the previous 2-3 decades, arbitrary seizure of wealth (and freedom) for some too-visible-or-vocal happy few, a tanking domestic equity market, a struggling Chinese housing market, ongoing difficulty to move wealth out of China with some form of capital control (at least for households), Chinese well-known gambling habits, and so on and so forth… Add to that, at the margin -or not-, also some growing retail demand from other EM economies such as India, Brazil, or less democratic countries, where the US treasuries have likely lost its some of its safety luster over the last two years.
Worse, (sentiment of) uncontrolled US budget deficits and rising US public debt could even be the primary sources of the troubles ahead considering the large net and gross supply of US sovereign bonds that will come to the markets in the coming months (note that corporates have done a much better job than governments by terming out/extending their debt maturities profile when rates were abnormally low) at a time when global central banks demand is decreasing and inflation risk premium is no longer stuck around 0%. On this topic, note that corporates have done a much better job than governments by terming out/extending their debt maturities profile when rates were abnormally low. That would explain (1) some part of the increase in US/global long rates over the last year, on top of resilient economic activity and sticky inflation, (2) why bond-equities correlation has turned positive, the resilience of gold, the outperformance of credit within the fixed income universe… as well as the growing interest surrounding fiscal dominance theory. Federal Reserve Bank of Saint-Louis published a research article on the on this topic at the end of last year.
For the non-initiated, fiscal dominance refers to the possibility that the accumulation of government debt and continuing government deficits can produce increases in inflation that “dominate” central bank intentions to keep inflation low. In other words, it would limit central banks’ ability to act/fight against inflation in a scenario where the Rubicon of (government) debt sustainability would be crossed. In this case, DM government bonds will logically lose their “n°1 safe haven privilege status” and gold becomes naturally a potential substitute! Think about it… (Negative) correlation between real rates and gold works well in bond bull’s market/when deflation risks are persistent and real rates are low… not in bond’s bear market with sticky inflation/positive real rates!
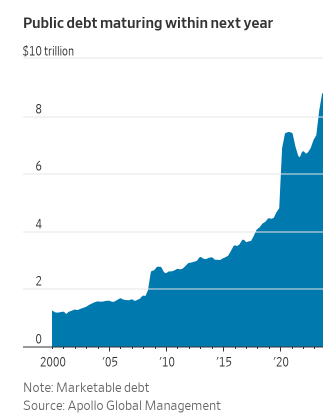
As a result, it also means that US rates have likely entered in a new phase or regime with a higher theoretical neutral rate as evidences continue to accumulate that the US economy seems able to handle higher rates. On this matter, the next Fed’s dot plot due during its June meeting should indeed show what they call the “longer run” rate creeping higher. In the meantime, treasuries are getting harder to sell as US and global economic activity continue to surprise to the upside, the Fed stays on hold for an extended period, and US fiscal deficits are, or at least seem, out of control with an impressive wall of debt just in front of us as the US government must refinance a record $8.9 trillion, roughly a third of outstanding US debt, in the next 12 months (that’s because US T-Bills represent now circa 25% of total US Treasury marketable debt…).
The second important question is what could end this bullish scenario for gold (and our bearish stance towards long term sovereign debt)? Needless to explore many ways as there is only one short and clear-cut answer, in my views: a really hawkish Fed of course! However, that seems currently even less probable than Cagliari staying in Serie A next season…
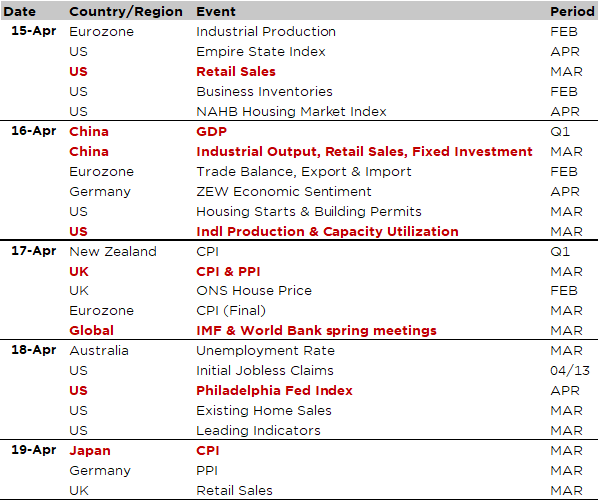
Economic Calendar
For the week ahead, forget -for a while- about monetary policy and, to a lesser extent- inflation, as it will be essentially about economic indicators from the US and China and the earnings season getting some traction. Other notable events for the week include the IMF & World Bank’s spring meetings taking place on April 17-19 with the IMF’s latest World Economic Outlook released just before (on Tuesday).
Starting with China, Q1 GDP data is due tomorrow along with the March figures for retails sales, industrial production and fixed investment. The consensus expects +1.6% QoQ growth (circa 6.5% a.r.), up from +1.0% in Q4 as the government has continued to support activity through a wide range of “half”-measures, while some signs of improvement have appeared with PMI indices inching higher lately.
In the US, we will get March retail sales tomorrow, industrial production on Wednesday as well as housing starts on the same day. The consensus points to decent-resilient gains in both retail sales and manufacturing activity, while the US housing sector continues to muddle through. Furthermore, some business sentiment indicators will also be released such as the NAHB Housing Market Index (today) or the regional manufacturing indices (Empire State Index this afternoon and Philadelphia Fed Index on Thursday), on top of the leading indicators index on Thursday.
While there is no major central bank’s meeting in the 1-week horizon, some important March inflation figures from the UK (Wednesday) and Japan (Friday) will hit our screens. For the former, it may tilt the timing of the BoE’s first cut more towards the ECB (in case of a lower than expected print) or the Fed (in the opposite case). For the latter, it may speed or not an additional BoJ’s rate hike before the summer. Staying in Asia, the spotlight will also be on general elections in India that begin on Friday and will last until June 1st.
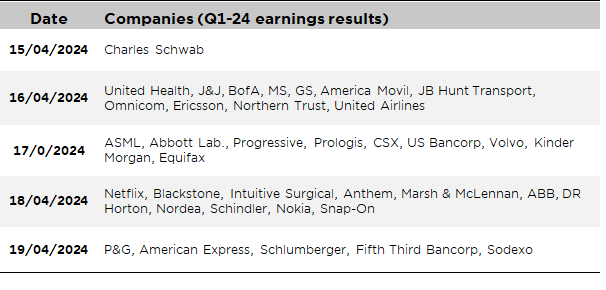
Finally, Q1 corporate earnings season will continue to ramp up, including several bank results (Charles Schwab, BofA, MS, GS or Bancorp,…), some tech AI-driven semiconductor firms (ASML, TSMC) as well as Netflix and some other S&P500 heavyweights including UnitedHealth, J&J, P&G.
Non-exhaustive list of major Q1-20224 earnings releases over the week
This is a marketing communication issued by DECALIA SA. It is neither directed to, nor intended for distribution or use by, any person or entity who is a citizen or resident of or located in any locality, state, country or jurisdiction where such distribution, publication, availability or use would be contrary to law or regulation. The information and data presented in this document are not to be considered as an offer or invitation to buy or sell any securities or financial instruments nor to subscribe to any services. The information, opinions, estimates, calculations etc. contained in this document reflect a judgment at the original date of publication and are subject to change without notice. Investments in any securities or financial instruments may not be suitable for all recipients and may not be available in all countries. This document has been prepared without taking account of the objectives, financial situation or needs of any particular investor. Before entering into any transaction, investors should consider the suitability of the transaction to individual circumstances and objectives. Any investment or trading or other decision should only be made by the client after a thorough reading of the relevant product term sheet, subscription agreement, information memorandum, prospectus or other offering document relating to the issue of the securities or other financial instruments. Where a document makes reference to a specific research report, the document should not be read in isolation without consulting the full research report, which may be provided upon request.
Unless specifically mentioned, charts are created by DECALIA SA based on FactSet, Bloomberg or Refinitiv data.