
In meteorology, we often distinguish between the actual temperature and the feels-like temperature – the latter reflecting how the air truly feels on our skin once humidity, wind, and other invisible factors are taken into account. In recent months, the US economy has been behaving much the same way: the numbers on the screen (inflation, growth, and employment data) tell one story, but the atmosphere that investors and households experience feels notably different.
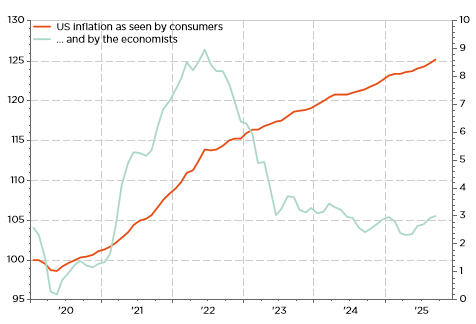
Take inflation, for instance. The measured temperatures – headline and core CPI, or the PCE deflator – has cooled impressively from its scorching 2022 highs. Core inflation has slipped closer to the Fed’s 2% target, and policymakers are congratulating themselves for orchestrating a “soft landing”, while investors are reaping the benefits of this supportive backdrop on paper. But for many Americans and households across the world, the feels-like temperature remains uncomfortably warm. Rent renewals still sting, grocery bills continue to sweat, and insurance premiums seem to have caught an ongoing heatstroke. The dissonance between measured and perceived inflation is widening. One explanation is that the official metrics underweight what actually burns consumers the most. The Bureau of Labor Statistics thermometer is accurate, but perhaps not pointed at the right part of the body. Structural cost pressures from housing scarcity, health care, education and most services with sticky wage components may not be cooling as fast as the headline suggests.
So, while the central bankers, the economists and the investors may eventually read a pleasant current or instantaneous 2% at some point, the average wallet continues to feel the pain of a cumulated 25% increase so far over the last 5 years -but still counting-. In the meantime, both headline and core annual inflation are still running well above 2%: 3.0% as of September to be precise according to the latest figures released last Friday. Moreover, even considering the last 3 months, none of the official measurements fell below 2% at an annual rate. Same story for alternative gauges: they all seem to have settle above 2.5%.
It’s the (cumulated) inflation stupid!
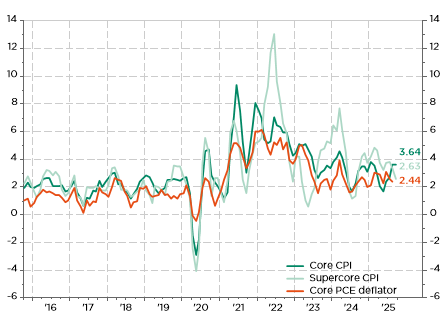
Q/Q% a.r. in core inflation, supercore & core PCE: not yet convincingly below 2% a.r. over the last 3 months
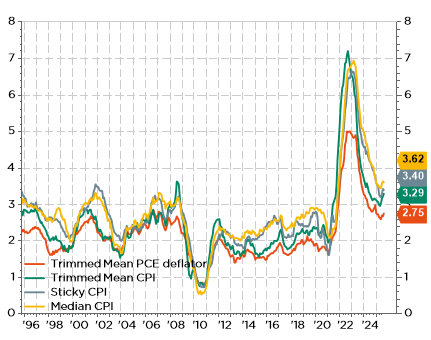
Alternative inflation gauges: bottoming up above 2.5%
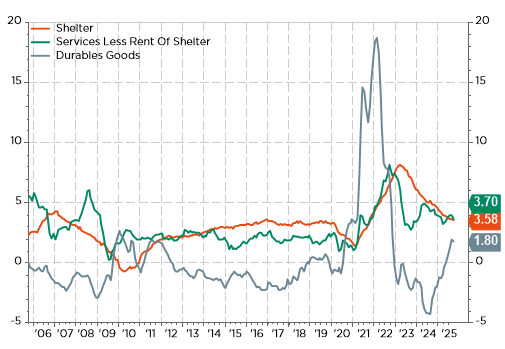
Furthermore, evidence that tariffs imposed by the US place upward pressure on goods prices continues to mount. As a result, US annual inflation rate -whatever gauges you look at- will now remain around the current levels at least until mid-2026… with a non-negligible risk that these tariffs may feed into dreaded long term inflation expectations.
Selected US inflation components: shelter and services still running too hot, while durable goods prices are now rising on the back of tariffs increase
In other words, even the “actual” inflation is still too high, while there is little evidence it will soon fall towards 2% in the foreseeable future.
Meanwhile, growth data paints the opposite illusion. GDP growth has slowed to what appears to be a winter chill: modest expansions, a consumer sector running out of stamina, and leading indicators suggesting frostbite ahead. Yet beneath the surface, the economy’s “core temperature” seems to be warming up. Labor markets remain quite tight, due also to the demographics trend -jut look at the unemployment rates in the euro area- combined with the new anti-immigration policy of the Trump administration. On this topic, a recent paper from the Dallas Fed by Anton Cheremukhin (“Break-even employment declined after immigration changes”) calculates that the pace of job growth needed to hold the unemployment rate constant is now… 30’000 jobs per month, not the previous 200’000 – 250’000 we were used to over the last three decades. Real incomes remain supportive enough as inflation ebbs, and corporate investment – particularly in AI, energy transition, and reshoring in the US- or government spending in Germany (defense, infrastructure and reindustrialization) are quietly reheating demand. In other words, while the official thermometer says “cool and comfortable”, the feels-like temperature might be approaching a mini heatwave… as we enter into the winter season.
This inversion creates an analytical hazard. Policymakers risk bundling up for a cold front that isn’t really there, while markets may underestimate how hot the underlying economy still runs. The result? A Fed debating cuts for risk management purposes…while wage growth and spending remain quietly tropical. Some investors, like overdressed joggers, may soon find themselves sweating through their too heavy long duration plays’ exposure. Of course, financial markets and participants love story telling and thus always need a good basic illusion. “Disinflation” sounds soothing, “soft landing” even more so. But if the feels-like economy continues to diverge from the measured one, surprises are inevitable.
The next few quarters could deliver what meteorologists call a “false spring” – a few warm days before another cold snap, or perhaps the opposite: a sudden heatwave just when everyone thought winter had settled in. In this latter context, we still see a strong case of being overweight US Treasury Inflation Protected Securities (TIPS) in bond’s portfolios: while there is no guarantee of positive returns in the short term -in case rates moves up faster than inflation expectations as it happened in 2022-, they should at least offer more resilience and thus outperform Treasuries over the next 6-9 months, in our views. Especially if the official US CPI were to stay above 3% (markets are currently pricing break-even inflation rates around 2.3% for the next 5y and 10y) or the USD continues to depreciate with an ongoing bleeding fiscal deficit, likely boosting the “feel-likes” inflationary pressures.
So, as we are currently flying blind while checking our economic thermometers this season due to the ongoing shutdown, remember: it’s not just the numbers that matters, but how it feels on the skin. Inflation may look pleasantly mild, but it has not been tamed yet. Growth may appear sluggish, but the underlying metabolism of the US economy is still burning calories fast under overall accommodative economic policies. And if you’re looking for an investment takeaway: maybe keep your portfolio layered because temperatures and winds often turn quickly and… unexpectedly.
Economic Calendar
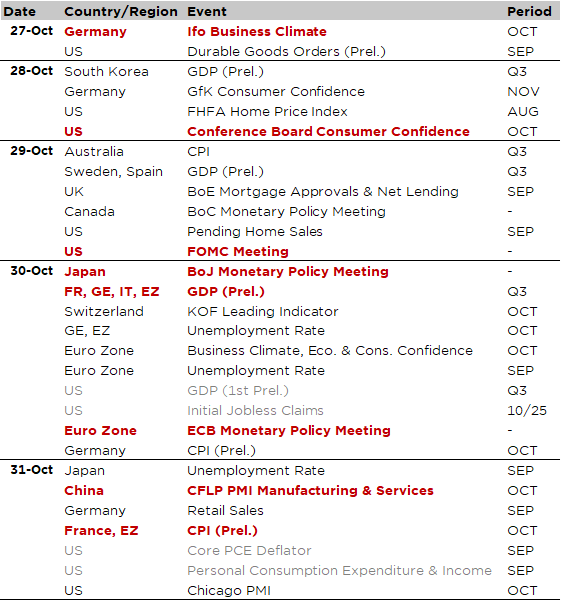
Here is the Halloween’s menu for the week ahead, where investors will have plenty opportunities to play more or less scary tricks or receive further treats depending on the outcomes of the following events and data releases.
First of all, investors focus will be on monetary policy decisions from the Fed and BoC on Wednesday, followed by the BoJ and ECB on Thursday, with a 25bps rate cut expected in the US and Canada, to 3.5%-3.75% and 2.25% respectively, while no change is expected in Europe and in Japan. The Fed should also announce officially or at least give more insights about the end of its Quantitative Tightening. As far as the ECB is concerned, it should be a non-event with rates kept on hold at 2%, whereas it’s likely again too soon to move/hike for the BoJ after the recent surprise election of Sanae Takaichi as the new PM (i.e. I suspect BoJ will certainly prefer to see the economic program cards of the new coalition before adjusting rates in accordance by setting the right tightening pace and terminal rates target).
Moving to economic releases, the ongoing US government shutdown will continue to affect “official” (read from government agencies) economic data releases in the US, including Q3 GDP, the September PCE deflator, along with personal consumption expenditures and income. In this context, there will likely be more emphasis on European Q3 GDP reports (Thursday morning) and the October flash CPIs on Thursday (Germany and Spain) and Friday (France, Italy and the Eurozone readings). We will also get the the consumer confidence indicators in the US (Conference Board), Germany on Tuesday and the Eurozone on Thursday. Note that Australia Q3 CPI will be released on Wednesday. Other notable economic sentiment indicators due include German IFO (today), Euro Zone business climate (Thursday) and October PMIs in China (Friday).
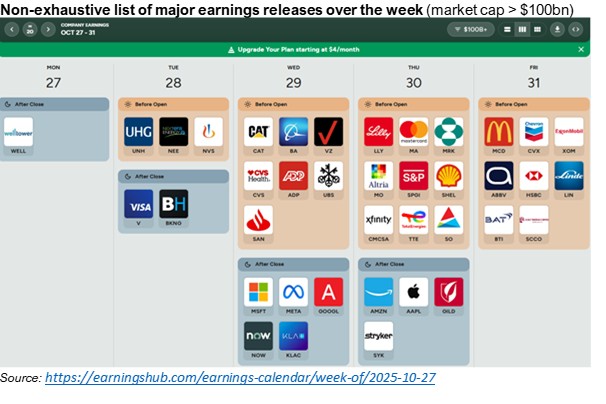
Another big chunk to digest for investors will be the earnings results from several mega caps IT stocks such as Microsoft, Alphabet, Meta (Wednesday), as well as Apple and Amazon (Thursday), representing a quarter of the S&P500’s market cap. Other notable large caps reporting include Eli Lilly, Visa, Mastercard, McDo, CVS and Exxon Mobil in the US; and Novartis, Shell, TotalEnergies, BAT and BASF in Europe. Finally, rounding up with geopolitics, the spotlight will be on US President Trump’s trip to Asia, where he attended the ASEAN leaders summit this week-end before going to Japan today and then heading to South Korea, where he is expected to meet with Chinese President Xi on Thursday at the APEC summit.
This is a marketing communication issued by DECALIA SA. It is neither directed to, nor intended for distribution or use by, any person or entity who is a citizen or resident of or located in any locality, state, country or jurisdiction where such distribution, publication, availability or use would be contrary to law or regulation. The information and data presented in this document are not to be considered as an offer or invitation to buy or sell any securities or financial instruments nor to subscribe to any services. The information, opinions, estimates, calculations etc. contained in this document reflect a judgment at the original date of publication and are subject to change without notice. Investments in any securities or financial instruments may not be suitable for all recipients and may not be available in all countries. This document has been prepared without taking account of the objectives, financial situation or needs of any particular investor. Before entering into any transaction, investors should consider the suitability of the transaction to individual circumstances and objectives. Any investment or trading or other decision should only be made by the client after a thorough reading of the relevant product term sheet, subscription agreement, information memorandum, prospectus or other offering document relating to the issue of the securities or other financial instruments. Where a document makes reference to a specific research report, the document should not be read in isolation without consulting the full research report, which may be provided upon request.