
- As focus on US debt ceiling is intensifying, the debt sustainability debate is naturally resurfacing. It’s a vast it’s a vast and complex matter.
- We present some facts and figures, flag some recent reports on this topic and bring some lights in order to assess debt sustainability key factors.
- Everything else equal… Behind these 3 anodyne words lies all the complexity linked to the dynamics of the debt and its sustainability because there are several constantly moving parts and moreover they interact between them.
- Good news too: high levels of debt could be manageable under certain circumstances and there are ways to get rid of them. But none is trivial and painless unfortunately.
- The increase in gold prices over the last 12 months – despite the headwind of higher nominal and real interest rates- should sound like a whisper to attentive investors. So, open your ears …and read this letter until the last paragraph if you can’t hear the gold’s whispers.
As focus on US debt ceiling is intensifying in a context of higher interest rates and growing concerns about economic growth slowdown, the debt sustainability debate is naturally resurfacing. People are thus talking about it (again), but very few have a clue or do something about it because it’s a vast and complex matter. So, the scope of this letter is just to give you an updated picture, flag some recent reports on this topic and bring some lights in order to assess debt sustainability, i.e. what are the key factors to look. In this way, you would be able to make your own informed opinion.
Let’s start with some figures and facts about our society’s propensity of debt’s overload: the nominal value of global debt (government + households + companies) measured in $ has reached about $300tn in 2022. It was $185tn in 2017 and about $120tn in 2007. The amount of debt matters, but it is more relevant to consider it relative to the income (i.e. GDP in case of a country). Today $300tn is equivalent to 350% of global GDP, about 25% more debt overload than the pre-GFC figure of 280%… These $300 translate into $37’500 of debt for every person in the world, compared to a GDP per capita of just $12’000 according to a recent S&P Global report.
World Debt to GDP, breakdown by agents
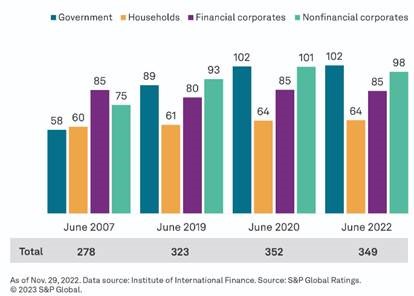
It’s worth noting that both households and financial corporates debt levels to GDP have remained quite stable over the last 15 years, while nonfinancial corporates debt and especially government debt levels have grown much more rapidly than GDP over the same period. At this point, it’s also worth underlining another key point, often dismissed when speaking about debt sustainability: we should also consider the assets… built or acquired through debt financing. For example, private households’ gross financial assets (including cash and bank deposits, receivables from insurance companies and pension institutions, securities -shares, bonds and investment funds- and other receivables) increased by +10.4% to a new record high of €233trn, which corresponded to three times the global nominal GDP, according to a report from Allianz.
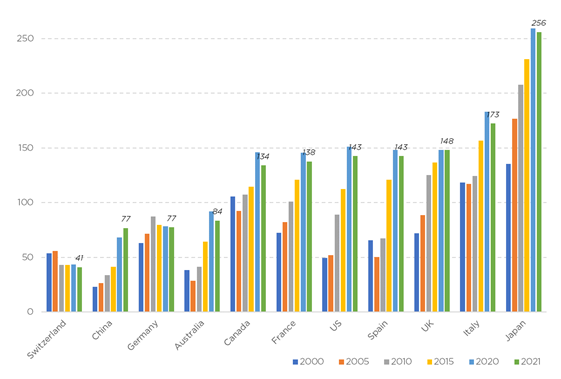
Let’s now focus on government debt “only”. Looking at the graph here below, government debt/GDP ratio has increased, very rapidly, in most major economies with some rare exception such as Switzerland. The GFC of 2008-9 and then the covid outbreak have both led to a significant step-up in debt level, while the anemic nominal growth of the last decade (i.e. in between these 2 events) hasn’t helped much to bring it back to more sustainable level… despite fiscal austerity and zero interest rate policy. However, it’s interesting to observe that thanks to stronger growth and inflation, government debt/GDP have stabilized and even fall in some countries since 2020 – but is still above pre-pandemic levels.
Sky is the limit? Government Debt as a % of GDP
So, if nominal growth stays above the cost of servicing debt, there is a way to avoid a debt overload spiral -assuming both a debt level not excessively above GDP and a balanced primary budget. Speaking about primary budget balance (the fiscal balance excluding net interest payments on public debt, i.e. the cost of servicing existing debt), the case of Italy and France is often cited as an example with the former having experienced very few primary budget deficits since 1980 (but it has run nevertheless quite significant deficit because of the debt’s servicing overload), while the latter has never enjoyed a primary budget surplus since 1980… As a result, the French government debt dynamic is clearly more worrying than the Italian’s one -everything else equal-.
Everything else equal… That’s obviously purely theoretical as behind these 3 anodyne words lies all the complexity linked to the dynamics of the debt and its sustainability because there are several constantly moving parts and moreover they interact between them. So, here are the key factors relevant when looking at a country’s (government) debt level:
- Real and nominal GDP growth (as it has an impact on government revenues)
- Interest paid on debt and current level of debt
- Fiscal balance (i.e. primary vs. secondary fiscal surplus/deficit)
- Type of expenditures (for what: consumption vs. investment)
- How the debt will be refinanced (duration, structure, inflation-linked, FRNs, etc.)
- Interaction between public and private debt (look for example at what happened in Spain, which had a debt level below 40% of GDP in 2007 on the back of a booming housing market… before Spanish government had to bail out more or less directly households and banks. Now, government debt stands at 140%, while private sector debt has declined from a peak of 200% in 2008 to about 130%)
- Who holds a country’s debt (domestic/resident economic agents vs. foreigners. For example, Japan’s government debt is held domestically)
As a result, a high level of debt may be manageable if
- Nominal growth is higher than yield on the outstanding debt
- The primary budget balance becomes positive
- Debt is used for (profitable) investments
- Outstanding debt is held by domestic economic agents (i.e. there is a large pool of private domestic savings = private sector is not overly indebted, which is the case of Italy for example)
- The average maturity / duration of the outstanding debt is high (no immediate refinancing needs. That’s the case of the UK)
- The current account is in surplus (no dependence towards foreigners to finance additional debt)
Furthermore, there are also different ways of reducing the debt level ratio either by targeting a lower level of debt (numerator) or an increase of GDP (numerator). Some are good, other less so, but none is painless. Here some ways for governments to escape the debt trap:
- Pro-growth policy reforms (ask President Macron for more details) or productivity gains driven by a new technology (we can still hope that AI will perhaps do the trick)
- Expenditure cuts or tax hikes. Not very popular, especially for governments with incentives to be reelected, and could even be counterproductive as they could harm GDP growth itself…
- Defaults or “hair-cuts”. When you have no other choices (Greece) but then it takes time to restore confidence and it doesn’t exempt the government from making reforms and embark in austerity in the meantime
- Inflation… a subtler form of default, as long as investors don’t ask for a much higher inflation risk premium to compensate for this risk, which tends to also translate into currency depreciation (think about EM, Italy or Spain in the 80’s or more recently the UK)
Speaking about debt, inflation and currency depreciation, the increase in gold prices over the last 12 months close to record reached in the summer 2020 – despite the headwind of higher nominal and real interest rates- should sound like a whisper to attentive investors. The debt ceiling issue is likely helping to sustain the “barbarian relic” nowadays, as well as central banks buying, which have added close to 1’500 tons of the precious metals (i.e. about 50% of annual production) to their reserves in the last 15 months, according to the World Gold Council. For the greatest joy of gold bugs, and less so for those with no end-of-the world scenario, there are currently a plethora of favorable and quite structural tailwinds for gold, starting with increasing recession risks, the turmoil in US regional banks, which dents again the fate of our fiat money system, but also higher for longer rates, which means higher costs of servicing debt and thus more red ink for government fiscal balance going forward, the US political gridlock and the overall difficulty to reforms globally, higher structural expenditures with an ageing population and the costs of the energy transition (look at Germany), the growing geopolitical uncertainties with a more fragmented world leading to a de-dollarization ongoing trend, especially from EM central banks and HNWI after what has happened to Russian economic agents, central banks credibility. And all that at a time when government debt has never been so high -relative to GDP- and is not expected to decrease soon… as nobody does much about it! In this context, the yellow metal may be seen as a barometer which warms us about mounting risks of an incoming debt storm as the US debt clock still ticks higher and faster, from $3tn when it was inaugurated in 1989 to more than $31tn today.
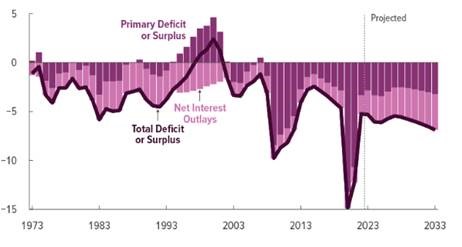
US budget balance as % of GDP (primary + net interest outlays), projection till 2033
US Federal Debt as a % of GDP, 1900-2053… and these bipartisan projections don’t even include recessions risks
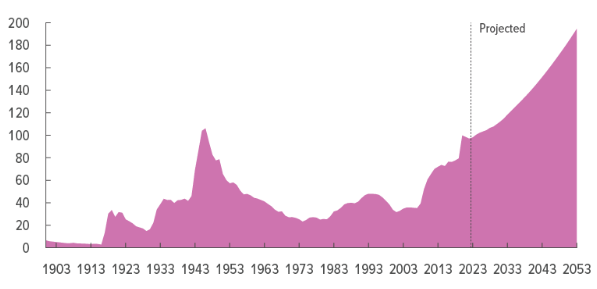
Source: CBO, https://www.cbo.gov/publication/58946
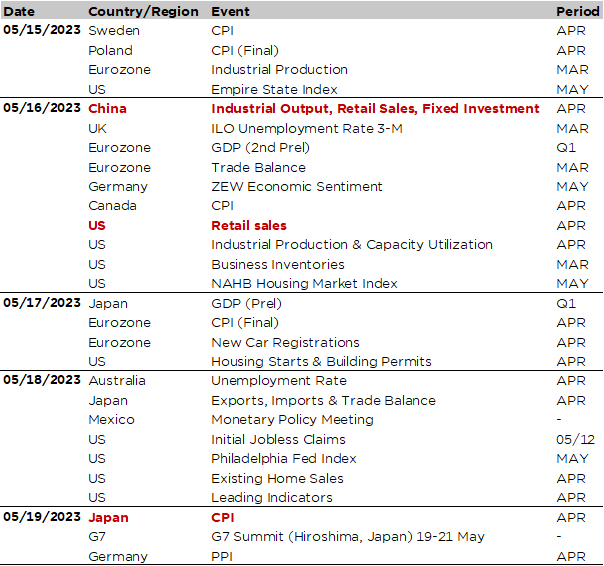
Economic calendar
For a change, lets’ start with the East as Japan and China will be home of some key data releases and events this week. In China, investors will focus tomorrow on April retail sales, industrial output and fixed asset investments. Due to more favorable base effects, consensus expects a big jump in yoy growth rates of these economic activity indicators, but the widening (and worrying) gap between booming consumption and the sluggish recovery in manufacturing/residential investment should persist. As far as corporate earnings are concerned, we will get the results of some tech giants such as Alibaba, Baidu & Tencent.
In Japan, the main events include the releases of the first estimate of the Q1 GDP (Wednesday) and the April CPI figures (Friday). According to the consensus, the GDP grew +0.8% a.r. last quarter, driven mainly by robust domestic demand, while the various inflation gauges are expected to tick higher at 3.4% yoy for the headline (vs. 3.2% in March), 3.4% for the core (3.1%) and 4.2% (3.8%) for core-core (i.e. excluding both fresh food and energy). Among Japanese companies releasing their earnings this week, financials will be on the spotlight with Sumitomo Mitsui, Mitsubishi UFJ and Mizuho. Finally, Japan will host a G7 Summit, which will take place from Friday 19 to Monday 21 May in Hiroshima.
Turning to the US, the key releases will be the April retail sales and industrial production figures (tomorrow), along with data on housing (NAHB index, housing starts & building permits and existing home sales). US retail sales are expected to increase +0.6% April, resuming growth after two consecutive months of decline, while industrial production, as well as housing activity, are seen edging lower or flattish at best. The Empire State and Philadelphia Fed manufacturing indices will also be published this week and we will thus be able to update our proprietary ISM manufacturing model. In the US, notable earnings results will be essentially concentrated in the retail sector with Walmart, Target, TJX and Home Depot. They will bring some more granular insights about consumer spending outlook and breakdown trends, on top of the retail sales figures.
Moving to monetary policy, we will get Mexico central bank meeting on Thursday (target rate should be kept unchanged at 11.25%), but, more importantly, a long list of appearances and speeches from top institutions’ central bankers, including Fed Chair Jerome Powell and ECB President Christine Lagarde.
To conclude with Europe, there won’t be really any key economic indicators releases, except perhaps the ZEW economic sentiment index for May (tomorrow) or new car registrations in April (Wednesday). Vodafone and Siemens will be among the largest European companies releasing their Q1 results this week.

This is a marketing communication issued by DECALIA SA. It is neither directed to, nor intended for distribution or use by, any person or entity who is a citizen or resident of or located in any locality, state, country or jurisdiction where such distribution, publication, availability or use would be contrary to law or regulation. The information and data presented in this document are not to be considered as an offer or invitation to buy or sell any securities or financial instruments nor to subscribe to any services. The information, opinions, estimates, calculations etc. contained in this document reflect a judgment at the original date of publication and are subject to change without notice. Investments in any securities or financial instruments may not be suitable for all recipients and may not be available in all countries. This document has been prepared without taking account of the objectives, financial situation or needs of any particular investor. Before entering into any transaction, investors should consider the suitability of the transaction to individual circumstances and objectives. Any investment or trading or other decision should only be made by the client after a thorough reading of the relevant product term sheet, subscription agreement, information memorandum, prospectus or other offering document relating to the issue of the securities or other financial instruments. Where a document makes reference to a specific research report, the document should not be read in isolation without consulting the full research report, which may be provided upon request.
Unless specifically mentioned, charts are created by DECALIA SA based on FactSet, Bloomberg or Refinitiv data.