
- We have witnessed several come-back recently: some were unexpected… like the Cagliari Calcio (but there is still a long way to go), others were much-awaited such as the return of a decent yield on most bonds.
- For those who actually feel lost in the long-time unexplored Fixed Income vast universe, let me be your humble guide.
- Putting myself in the shoes of Mr. Bond for a while, I am going to underline 007 ingredients or place I deem worth to consider if you are currently planning to build a fixed income portfolio or allocation.
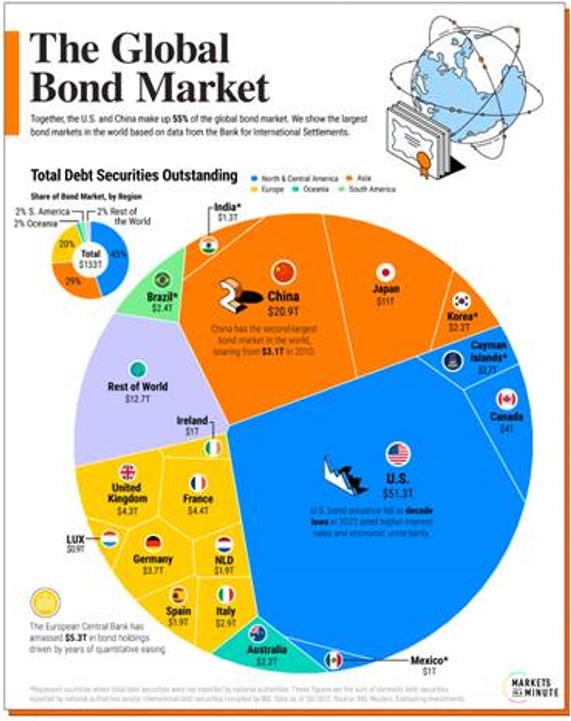
Heading into the right direction, but there is still a long way to go. So, it’s too early to claim victory as “it ain’t over till it’s over”. These sentences may apply to inflationary pressures, as well as the US debt ceiling saga or… the Cagliari Calcio! Yes, my dear readers, after more than 200 days of silence (I last mentioned my favorite Italian soccer team in my letter of October 3rd 2022, when “everything was going down”), my “rossoblu” heart is beating again as Cagliari is qualified for the playoffs starting next Saturday to eventually return in Serie A next season. Who would have believed it after a catastrophic first half-season (ranked 14th after 18 games, they finally ended 4th)? So, fingers crossed for the incoming playoffs. And the same applies obviously for inflationary pressures, the slowing down of economic activity and the debt ceiling developments over the next few months, weeks and days. In the meantime, we have also witnessed the unexpected powerful comeback of the US big tech this year or the much-awaited return of a decent yield on most bonds (not so long, about $18th of bonds were trading at a negative yield). After a decade of devastating ZIRP &QE on the back of a plethora of apocalyptic events such as GFC, EU sovereing debt crisis, Brexit, hectic Trump presidency, Covid virus leading to lockdowns, Russia’s invation of Ukraine, the wreckage of Credit Suisse and even… the crash of the Ark, life life on Fixed Income Universe is back as interest rate gravity has finally been restored. We can now safely leave the TINA’s space station and return to bonds. For those who actually feel lost in the long-time unexplored Fixed Income vast universe (with more than $130tn of market cap, it is actually largest than the world equity market and, including non-quoted loans, it is even 3x bigger according to BIS), let me be your humble guide. Incidentally, apart from my passion for sports, and Cagliari Calcio in particular, as well as reading tea leaves & crystal balls for professional purposes, I also happen to manage fixed income portfolios & funds indeed as a more serious job.
The Global Bond Market was ballooning at $133th at the end of 2022
You won’t find a precise map or recipe here below as, like every asset allocation, it depends on your return objectives, risks constraints as well as your time horizon or your base currency. However, putting myself in the shoes of Mr. Bond for a while, I am going to underline 007 ingredients or place I deem worth to consider if you are currently planning to build a fixed income portfolio or allocation.

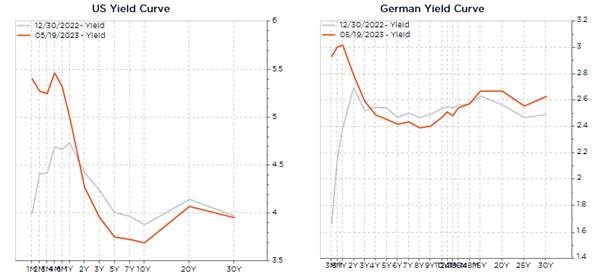
# 001 Cash and monetary instruments The front end of the curve has experienced a massive repricing over the last 12 months on the back of the fast and aggressive monetary policy tightening of central banks from the vast majority of DM economies (except Japan obviously). As it is now coming to an end and with yield curve already significantly inverted, what’s the point to take excessive duration risks currently if you don’t expect a severe recession and/or an ongoing disinflation trend which will bring “easily” inflation back to central banks’ target. As our scenario still points to a soft landing, or anemic growth for longer if you prefer, but without an economic activity crash leading to a massive jump in unemployment rate, whereas inflation will likely remain above central bank’s target for longer than expected, we strongly believe cash and monetary instruments (top quality bonds with less than 12 months maturity) offer the best risk-adjusted returns within the fixed income universe, especially in this challenging context. What if (short term) rates remain higher for longer? Or inflation stickier than expected? In other words, there isn’t much convincing rationale to go overly long in fixed income duration if you don’t expect a crash in nominal GDP growth. Furthermore, as Warrant Buffet often says, cash may also be seen as “a call option with no expiration date, an option on every asset class, with no strike price“
US & Germany yield curve as of end of last year (light grey) and now (orange): appealing yield on the short end of the curve
# 002 2-3y inflation-linked bonds
Speaking about sticky inflation over the next 2-3 years, there is a way to hedge somewhat against this risk. Actually, 2-3 inflation-linked bonds are already pricing a return to a “well-behaved” and benign inflation environment in the near term. As a result, you can get the US TIPS 0.125% Oct 2026 at a real yield of 1.6% as investors are pricing an average US inflation of 2.2% until maturity as the usual “normal” UST 3y trades with a (nominal) yield of 3.8% (3.8% – 1.6% = 2.2%). In other words, if average US inflation will prove higher than 2.2% over the next 3y, you will be better off with the inflation-linked bond -assuming you keep it until maturity-… Same story applies for the euro area, Germany 0.1% Apr 2026 and Italy 1.7% may 2025 trades currently with real yield of respectively 0.25% and 1.7%, which means they are embedding an expected inflation of 2.25% in Germany over the next 3y and… 1.7% in Italy over the next 2y. A very complacent view on inflationary prices pressures developments according to me!
# 003 UST duration (through 20y tenor)
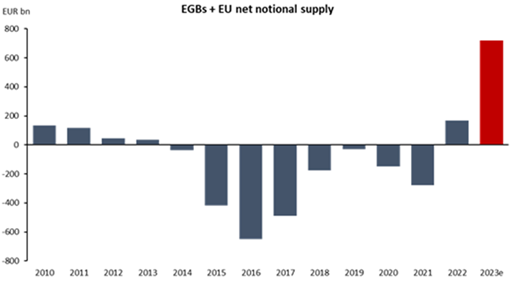
Despite my quite constructive scenario on (nominal) growth, it may be worth consider hedging tail risks within a bond’s portfolio allocation, either because of an unknown unknow or more probably because I may be wrong (i.e. both growth and inflation collapse). Anyway, some cautiousness is warranted with growth slowing down and restrictive monetary policies across most economies. In this case, it’s always worth being exposed to some duration risks in top quality (and liquidity) assets. We are opting for UST long term bond and more precisely the 20y tenor as it is offering a yield pick-up of +40 bps vs the 10y and +15bps vs. the 30y (see US yield curve graph here above). You may thus benefit from this dislocation (due likely to crowding effect on the more obvious and tradeable 10y and 30y benchmarks/futures contracts) by grabbing some additional yield. Note that we prefer US duration over EUR duration as downward risks to growth are currently larger in the US than in Europe (Fed hiked faster and higher, commercial real estate concerns, regional banks turmoil, likely more leveraged households and companies overall), UST are more liquid and will react better to risk-off events than EU duration, inflation may be stickier in Europe because of a more rigid labor market and its dependency to imported energy (out of control from monetary policy) and unfavorable supply dynamics in the form of a tsunami of net debt issuances form EU governments and institutions in the same time as ECB will now shrink gradually its balance sheet (QT).
European Government Bonds and EU Bonds net supply:
# 004 IG credit 1-5y, especially in EUR
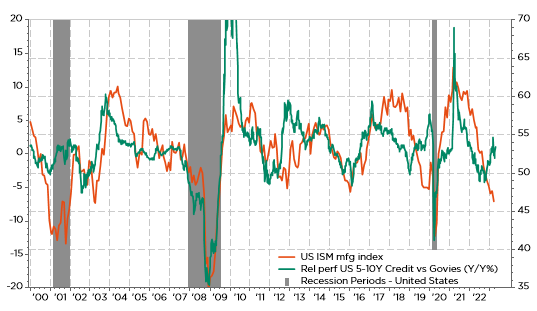
This allocation currently represents the bulk of our bond’s mandates & funds as you get decent yield with contained duration and credit risks. Companies balance’s sheet are healthy, with no wall of debt in the next 2-3 years (i.e. no significant refinancing needs), while credit spreads have already integrated downside risks to growth, especially in the EUR bonds market -less so in the US where there is perhaps more complacency-. That’s a buy and hold approach to get some extra-yield compared to cash and monetary instruments. You should be able to get 4%-4.5% in EUR for 2-3y maturity with an average rating of A-BBB (i.e. about 5.5%-6.0% hedged back in USD). While I also feel at ease with some cross-over names (BB+) that will likely be upgraded soon (i.e. rising stars), or some high-yield short term bonds managed actively by (external) specialists, I would avoid to get too long in duration and take too much credit risks at this stage of the cycle (see graph below). So, selectivity and diversification are key.
US ISM mfg index and relative performance of 5-10y IG credit vs UST: focus on „superior“ quality when economic and financial conditions become more difficult
# 005 Subordinated Debt
Here is a place not suitable for widows nor orphans… But where you will likely find the most attractive yield after the recent dislocation due to the US regional banks turmoil and the wiping out of $17bn of Credit Suisse AT1. In this area, selectivity remains key but they are several managers/funds with the skills and resources to navigate this tumultuous market. As most of these bonds are now priced for perpetuity (i.e. they are trading as if they won’t be called back by the issuer at their first call date), the main risk you are taking is -like in the case of Credit Suisse- to be completely wiped out if you pick the wrong horse. That’s why it may be wiser, especially for “smaller” portfolios, to get some exposure through a fund. Let me just illustrate how attractive yields can be in this area with 2 examples in EUR:
- Deutsche Bank subordinated bond with a coupon of 10%, a first date call in December 2027, which is currently trading below 100 (i.e. yield-to-call > 10%). In case it is not call called, the coupon will reset to the Euribor Swap Rate 5y (currently 3.14%) + 6.94% of spread = 10.08%… As long as the CET1 of DB remains above 5.125%: it is currently standing at 13.4%, which leaves some room
- FinecoBank subordinated bond with a coupon of 5.875%, a first date call in December 2024, which is also offering a yield-to-call > 10%. In case it is not call called, the coupon will reset to the Euribor Swap Rate 5y (currently 3.14%) + 6.14% of spread = 9.28% of coupon… for a current price below 100. As long as the CET1 of Fineco Banca remains above 5.125%: it is currently standing at 21.8% !?
In every crisis or dislocation lie the seeds of opportunity…
# 006 Hybrid debt
Same story as above but with less risk and less juice obviously, but still offering an attractive yield for companies that are top quality investment grade issuers for their senior debt. Again, selectivity is key. So, it may be wise to avoid the real estate sector and be suspicious about yield in excess of high single digits, but you will find plenty of names in sectors that are usually less cyclical or at risk of excess leverage such as energy, utilities or telecom. Focus on bonds with a short call date (let’s say less than 5y) and high reset coupons (companies will be incentivized to recall your bond) for yield-to-call in between 5%-7% in EUR, i.e. often higher that what you will get in the EUR HY universe with companies less well-established and more fragile financially, i.e. more at risk of defaulting on their senior debt compared to subordinated debt of top-rated companies.
# 007 Non-ESG issuers
Like James Bond’s character, it’s politically incorrect and very much controversial in the current reign of ESG investing nowadays. Investing in bonds of tobacco, car makers, alcoholic beverage or mining companies won’t give you the same thrills and excitement of James Bond’s adventures, but nevertheless you may enjoy some extra-yield as many investors cannot trade them anymore… So, focus on maturity < 5y, check out the liquidity and favor a buy and hold approach. Live and let die them mature.

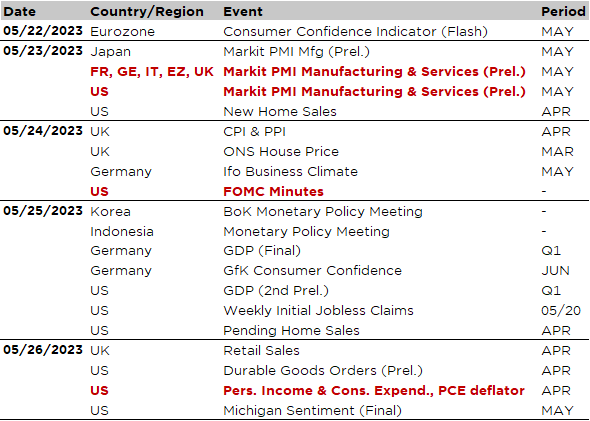
Economic calendar
It will be a quiet week as far as economic data (and companies’ earnings) releases are concerned. The main highlights include the global flash PMI indices for May (tomorrow), the minutes of the latest Fed meeting on Wednesday and the US core Personal Consumption Expenditure (PCE) deflator on Friday. The flash manufacturing and services PMI indices will give investor the first insights on how the major economies have fared so far this month: are there some (tentative) signs of stabilization? Is the negative momentum accelerating? What’s about the divergent trends between manufacturing and services activity… Widening further or tightening (with services catching down)? And, is the US economy still underperforming to some extent according to these PMI indices?
In the US, the debt ceiling saga will likely continue to make some noise and headlines as we are getting closer to the X-date deadline, which could be as soon as June 1st according to Janet Yellen (but nobody knows really when precisely the US Department of Treasury would hit the debt ceiling wall). As investors have already started to anticipate a happy-end before the deadline, any negative newsflow may push financial markets volatility higher and risk-on assets lower. In the meantime, we will get the FOMC minutes on Wednesday, which will be scrutinized to find any hints confirming a pause… or not, given last week Fed’s members hawkish comments. The personal income and spending report for April, due Friday, will also contain the saving rate as well as the Fed’s favorite inflation gauge, namely the core PCE deflator. The consensus expects +0.3% MoM, keeping YoY core inflation unchanged at 4.6%… a run rate that remains well above the Fed’s target. Other notable US economic data include April new home sales (tomorrow) and April durable goods orders (Friday).
Turning to Europe, the key highlights are the German IFO index for May and the UK April CPI, both released on Wednesday. According to the latest CPI reading, UK inflation was still running at 10.1% in March… Consensus expects headline inflation to fall to 8.2% in April, with core inflation likely remaining unchanged at 6.2%. Anyway, this report will have a large influence on the next BoE decision (22 June). Apart from UK inflation data, April UK retail sales will also be released on Friday.
From central banks, we will get the May FOMC meeting minutes on Wednesday (see above), Korea and Indonesia monetary policy meetings (Thursday) and speeches & interviews of several central banker, including BoE Governor Bailey’s appearance. Finally, as the earnings season is winding down, there is not much left to look forward to this season but among the notable releases of this week, you can pencil Nvidia (Wednesday), Snowflake & Palo Alto Networks in the tech sector, as well as Lowe’s, Costco and Dollar Tree for the retailers.
This is a marketing communication issued by DECALIA SA. It is neither directed to, nor intended for distribution or use by, any person or entity who is a citizen or resident of or located in any locality, state, country or jurisdiction where such distribution, publication, availability or use would be contrary to law or regulation. The information and data presented in this document are not to be considered as an offer or invitation to buy or sell any securities or financial instruments nor to subscribe to any services. The information, opinions, estimates, calculations etc. contained in this document reflect a judgment at the original date of publication and are subject to change without notice. Investments in any securities or financial instruments may not be suitable for all recipients and may not be available in all countries. This document has been prepared without taking account of the objectives, financial situation or needs of any particular investor. Before entering into any transaction, investors should consider the suitability of the transaction to individual circumstances and objectives. Any investment or trading or other decision should only be made by the client after a thorough reading of the relevant product term sheet, subscription agreement, information memorandum, prospectus or other offering document relating to the issue of the securities or other financial instruments. Where a document makes reference to a specific research report, the document should not be read in isolation without consulting the full research report, which may be provided upon request.
Unless specifically mentioned, charts are created by DECALIA SA based on FactSet, Bloomberg or Refinitiv data.