
- So far, so good! US economy and markets continue to defy downbeat investors’ expectations
- US equity market valuation remains stretched in absolute and relative terms… as TINA’s aunties are still hanging around in other markets such as in Europe or Japan
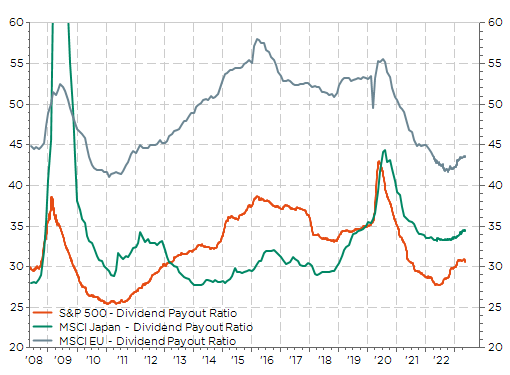
- Different dividend payout ratios, shares buyback programs, as well as different sectors’ allocations also explain valuation/performance differences across markets
- Anyway, the outperformance of US mega tech stocks experienced since the GFC may continue but I believe it should be, at minima, less significant from now.
- As a result, a wise recommendation for investors would be to diversify outside the “growthier” US equity markets/US mega tech cap
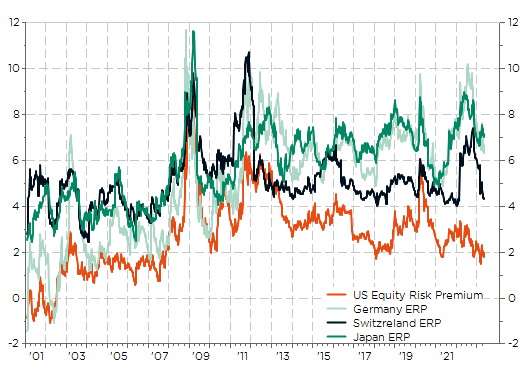
So far, so good! Both US companies’ earnings and economy continued to defy downbeat investors’ expectations (included mine) last week. However, as I mentioned one week ago, US equity remains at risk due to its historical and relative stretched valuation, especially in case of any disappointments down on the road (weaker growth, margin compression, regional banks trouble, higher for longer rates, the recurring debt-ceiling issue or pick your own mix of these toxic ingredients). In particular, its Equity Risk Premium has come back to very low levels while Europe and Japan remain quite elevated. It’s a function of both higher rates and more expensive equity valuation in the US, which is usually the norm because of its intrinsic “growth” and predominance characteristics.
Selected Equity Risk Premium (E/P -10y rate)
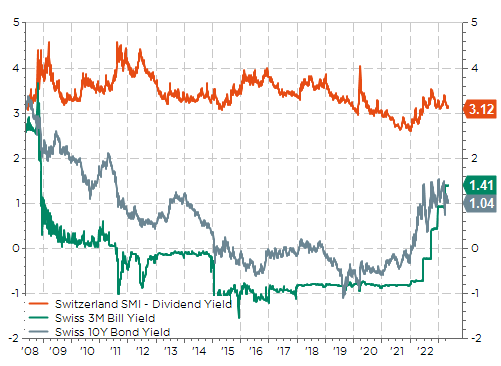
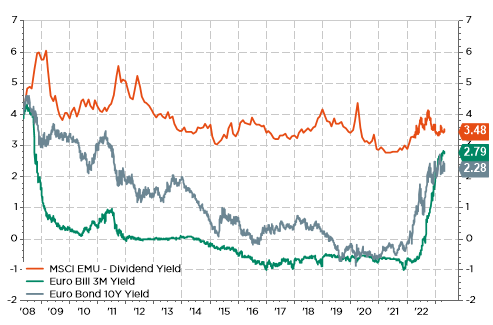
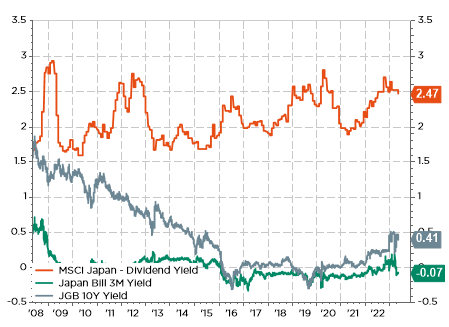
Another way to look at this stretched US equity valuation involves to refer to TINA… As you are aware, TINA (There Is No Alternative) has left the building and has now been replaced by TATA (T-Bills Are the Alternative) as US cash yield (around 5.3% currently) are far more appealing than UST 10y yield (3.5%) and US dividend yield (1.7%). But that’s a very US centric view… because if you look attentively around you, you will actually see that TINA’s aunties are still hanging around in other markets such as in Europe or Japan.
TINA is still hanging around in Switzerland, Euro Area and more than ever in Japan
Swiss cash, bond and equity yield
Dividend Payout Ratio in US, Japan and European Union
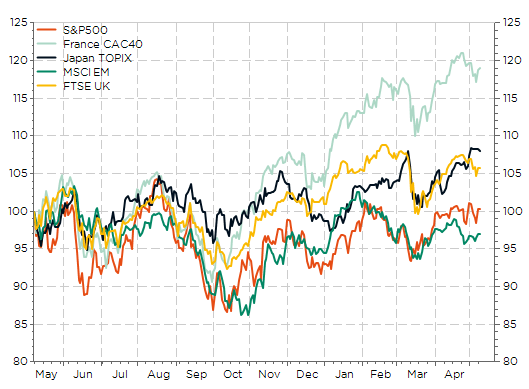
Selected equity market indices performances over the last 12M: US has lagged for once
MSCI US, Japan, Europe and EM (rebased at 100, 15y ago)

As a result, a natural, obvious and wise recommendation for investors would be to diversify outside the “growthier” US equity markets/US mega tech cap. It’s now a way to diversify the risks without sacrificing the returns.
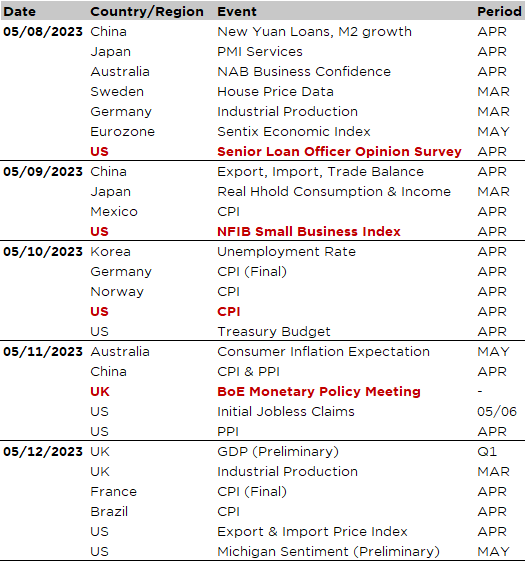
Economic calendar
Following last week Fed & ECB “non-event” central’s banks meetings and then the much better than expected (or should I say “hotter”?) US job report, investors’ attention will now turn to the US CPI print for April on Wednesday. It will be thus the key (planned) event of the week: consensus expects headline and core inflation to increase respectively +0.4% and +0.3% MoM in April, which would translate into steady YoY change compared to previous month of 5% for headline and 5.5% for core inflation… if consensus proves right. Upside risks can’t be ruled out, which may instill doubts on investors and central bankers mind about the gradual disinflation trend experienced over the last few months. Anyway, current figures still remain uncomfortably high for the Fed. Investors will thus also scrutinize inflation in services (excluding shelter), closely tied to wages growth and overall labor market tightness, as well as any signs of shelter starting to roll over more significantly. Note that we will also get the US PPI on Thursday and export and import prices on Friday, on top of other April CPI prints for a few major EM economies such as Mexico (tomorrow), China (Thursday) and Brazil (Friday). It’s worth keeping in mind that inflation isn’t really an issue for them in this cycle, i.e. not higher or less under control than usual, actually quite the opposite…).
Staying in the US, other notable economic reports include the University of Michigan consumer sentiment survey on Friday, which is expected to remain basically unchanged (specific questions related to inflation expectations, feeling about the labor market or willingness to spend may be worth a look), the NFIB Small Business optimism index tomorrow (here too, details and components may be more insightful than the headline reading) and the Senior Loan Officer Opinion Survey (tonight). It will be key to assessing how credit conditions have evolved amid the recent turmoil in the banking sector and what the potential implications for the economic outlook are. Finally, there will certainly be new twists and turns in US debt-ceiling saga over the next few days, while the likely “happy-end” seems still far away and uncertain.
Turning to Europe, the main event will be the BoE monetary policy meeting on Thursday (+25bps to 4.5% expected with still a non-unanimous vote as they are a few more hawkish and dovish dissidents), followed by UK GDP preliminary figures on Friday. As far as the Euro Area is concerned, it will be a quiet week with German industrial production today, the final April CPI figures and “nobody-cares” trade balances data.
As usual, let’s conclude with the earnings season. EU and Asia corporate releases are now somewhat moving in the forefront as more than 80% of the S&P500 companies have already reported. Among the key highlights of this week, here is my selection: Berkshire, Disney, Toyota, Aramco, Paypal, Nintendo, Electronic Arts, Deutsche Telekom, NTT or Credit Agricole.

This is a marketing communication issued by DECALIA SA. It is neither directed to, nor intended for distribution or use by, any person or entity who is a citizen or resident of or located in any locality, state, country or jurisdiction where such distribution, publication, availability or use would be contrary to law or regulation. The information and data presented in this document are not to be considered as an offer or invitation to buy or sell any securities or financial instruments nor to subscribe to any services. The information, opinions, estimates, calculations etc. contained in this document reflect a judgment at the original date of publication and are subject to change without notice. Investments in any securities or financial instruments may not be suitable for all recipients and may not be available in all countries. This document has been prepared without taking account of the objectives, financial situation or needs of any particular investor. Before entering into any transaction, investors should consider the suitability of the transaction to individual circumstances and objectives. Any investment or trading or other decision should only be made by the client after a thorough reading of the relevant product term sheet, subscription agreement, information memorandum, prospectus or other offering document relating to the issue of the securities or other financial instruments. Where a document makes reference to a specific research report, the document should not be read in isolation without consulting the full research report, which may be provided upon request.
Unless specifically mentioned, charts are created by DECALIA SA based on FactSet, Bloomberg or Refinitiv data.