
- A special edition for the 1st of May, with a longer than usual letter mixing my thoughts on the economy, the markets and positioning with the economic and earnings calendars.
- Economic growth: a less worrisome US Q1-2023 report than suggested by the headlines but US ISM and global PMI will give us a more updated picture of current dynamics. What are the key points to watch/assess through these upcoming readings
- Inflation issue: it’s still too early to claim victory
- Monetary policy: investors are already looking beyond the peak (rates): we see a plateau, while markets see a downhill
- How to position on the US yield curve? A free lunch is available on the 20y tenor
- US equities markets: Big Tech is everything, everywhere all at once… till it doesn’t. I can give you the “why” but it remains more than ever difficult to guess (precisely) the “when”.
1st of May… should your humble servitor work and deliver its weekly letter? The Labor Day is an annual holiday in most countries with several markets being closed today, Switzerland included. But here in Geneva, we are working while the public sector enjoyed a day off despite the current left government has just lost its majority yesterday. In short, I am opting for the middle way, delivering my usual letter in a not-so-condensed manner, in hindsight, mixing some of my thoughts on the economy, the markets and positioning with the economic calendar.
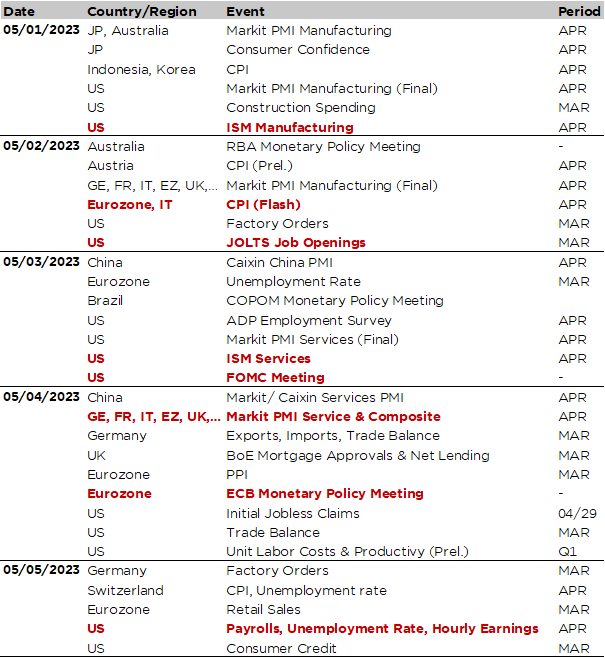
So, the month of May is finally here and I don’t need to remember you the old adage … So, the question remains “The good, the bad or the ugly” outcome? We will already see what this week has in store for us in terms of overall markets actions. It won’t depend much about seasonality but more obviously about some key events and data awaiting us such as the Fed meeting on Wednesday evening, the ECB decision the following day or the US jobs report on Friday. In the meantime, other important data may also prove crucial starting with the latest global PMI indices (tomorrow and Thursday) and the US ISM prints (manufacturing index for April this afternoon and services one this afternoon), which will also provide an update on major economies and US growth momentum in particular.
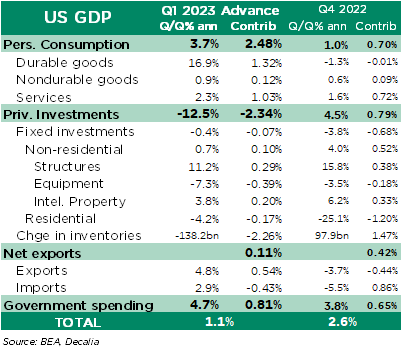
Last week’s release of US Q1-2023 GDP advance report was less worrisome than feared despite the disappointing headline. US real GDP came indeed below consensus as it increased at an annual rate of 1.1% in Q1 vs. +1.9% expected and after +2.6% a.r. the prior quarter, but demand proved surprising resilient on the back of strong increases in consumer spending (+3.7% a.r.), especially durable goods (+16.9% led by a surge in motor vehicles & parts), on top of gains in net trade (+0.1% contribution) thanks to a rebound in exports growth and government spending (+0.8% of contribution). These gains were however largely offset by a decrease in private inventories, which shaved off as much as -2.3%. There are however 2 important caveats… (1) this “advance” estimates could be revised quite significantly over the next 2 months, to the extent of plus or minus 1.5% for the headline and (2) that’s a backward-looking report with little insights unfortunately on what’s going since April and even less on what lay ahead of us in terms of US economic growth and inflation. While “prediction remains difficult especially about the future”, we still expect low growth (but no severe recession) and above target inflation in the foreseeable future.
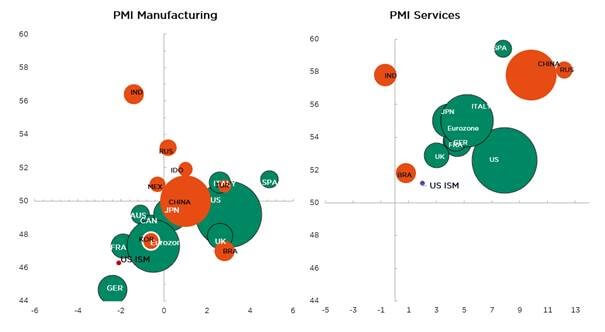
As a result, the US ISM indices and global PMI prints will provide a more leading update on the overall growth picture. According to me, the key questions are:
- Will US ISM manufacturing index remain above 45? Consensus expects a rather stable figure around 46-47 in April vs. 46.3 last month but if it falls below this psychological 45 threshold, investors may start pricing a more significant growth slowdown (not to say a more severe recession)
- Will the rest of the world continue to outperform the US, which are actually the major economy with the most downside growth risks (swift monetary policy tightening, commercial real estate woes, regional banks turmoil, debt ceiling psycho-drama to mention a few issues)? Or will the other ones catch down, especially the euro area after the weak German Q1 GDP print, current French woes (political instability), potential downside risks with the dependency on energy supply and a tsunami of sovereign debt net supply and subsequent spreads widening risk… that can only rise with a hawkish ECB and the end of TLTRO at some point.
- What’s about the dichotomy between strong/resilient activity in global services vs. weak/contracting activity in global manufacturing. Will it persist or will services catch down too?
- Last but not the least, while there is no doubt that China growth will recover this year on the back of the re-opening, there are still some doubts among investors about the quality and sustainability of this recovery. So far, it has been led by a strong rebound in consumption and services but manufacturing and housing remain desperately weak, whereas geopolitics concerns still hang over and weight on Chinese technology stocks valuation. Thus, China PMI will also be closely scrutinized.
Global PMI and US ISM: manufacturing & services indices, March’s level (vertical axis) and 3M trend (horizontal axis)
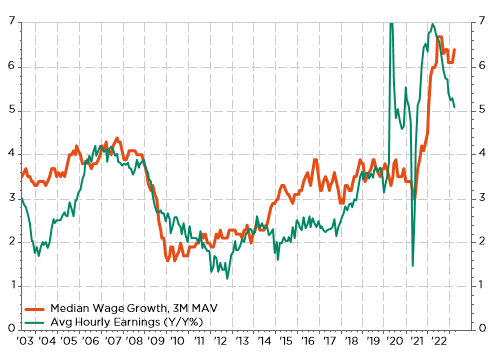
On top of the headlines reading, gauges on new orders, prices and employment will also be closely watched. In the US, we will also get the US job report on Friday: the consensus expects payroll gains to slow to 180k in April from 236k the prior month, the unemployment rate to tick up from 3.5% to 3.6% and unchanged gains in hourly earnings (+0.3% MoM). Note that the recent decline of the average wage growth is somewhat misleading given the overall “heterogeneity” of the US labor force and the change in the mix of workers pool because the median has barely moved yet (see graph below). If that is true, it means less inequality and more propensity to consume as “low wages” are growing faster than “high ones”. A rather reassuring point for the resilience of US consumption and economy but less so for those concerned by sticky inflation. The JOLTS (jobs opening and quits rate) and ADP reports are also due this week, respectively tomorrow and on Wednesday.
US median & avg wages growth
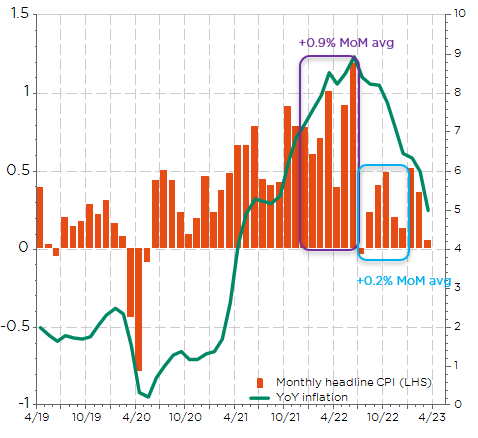
Released in the same time that US GDP last week, the core PCE prices rose indeed a hotter-than-expected +4.9% annualized (vs. +4.7% expected) and up from +4.4% in Q4, which puts a dent in the narrative that inflation is heading lower now. In Europe, the picture remains quite mixed with headline inflation falling rapidly thanks to lower energy / natural gas price on the back of a mild winter to a large extent but still very elevated core inflation. To make it short, it’s still too early to claim victory on the inflation battle, especially for central bankers who will remain on their guards for a few more months, and probably at least until the end of this year because of unfavorable base effects in H2 (see graph below) and the risks of higher energy prices in coming months (low inventories, geopolitics and Chinese recovery).
Mind the base effect for US headline inflation… from favorable in H1 to unfavorable in H2
Turning to central banks, Fed and ECB decisions will thus be the key highlight of this week to gauge how policymakers are viewing this current mix of still high inflation and slowing growth in the context of substantial monetary tightening. The Fed (Wednesday) will deliver a final +25bps hike for this cycle and moved then into a wait and see mode according to us, assessing the full impact on growth and inflation of its 500bps tightening in just 14 months. With markets still pricing about 2 rate cuts by year end, attention will shift from now to the messaging around how long the Fed may keep rates on hold. Commentary on the the recent banking turmoil ripple effects and consequences on growth outlook (and inflation, to a lesser extent) will also be closely watched. Note that some experts assume that it will shave about -0.4% to GDP growth in the next 12 months.
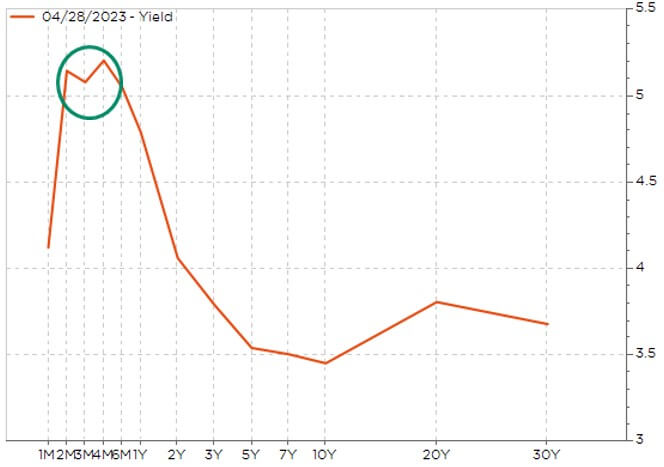
In this context of slowing growth and sticky inflation, bonds investors will likely continue to favor a barbell strategy mixing short and long maturity while avoiding or being light on the belly of the curve. On pragmatic manner, we advise to favor 6-9M Treasury bills and top-rated IG bonds with maturity of maximum 12 months on the short end of the curve: they will outperform if US economy proves resilient and/or inflation remains sticky, dashing the hopes of a Fed’s pivot soon, while focusing the severe recession tail risk hedging with 20y US Treasuries. As you can see here below, the 20y Treasury offers a higher yield than both the 10y and 30y tenors because it is less crowded (no future contracts). By the way, you can also see the distortion caused by the debt-ceiling concerns/fears on the short end of the curve with investors favoring maturities before July.
US Treasuries Yield Curve: even the most liquid markets aren’t so efficient sometimes
Over in Europe, all eyes will be on the ECB on Thursday. Most economists expect a downshift to a +25bps hike but it is a close call. Anyway, there is a consensus about a rather hawkish stance with at least 50bps to 75bps of additional increase in target rates, which means the ECB may deliver 2 other 25bps rate hikes in June (15/06) and July (27/07) if it opts for 25bps this month. The focus will thus be on how much further the central bank may need to tighten given persistent core inflation, stickier wages growth and its delayed monetary cycle (due to the war in Ukraine). It’s worth mentioning that we will get the flash Eurozone CPI print for April earlier on the same day…
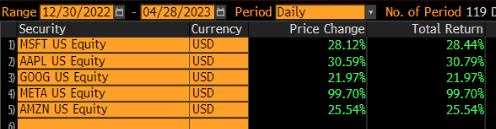
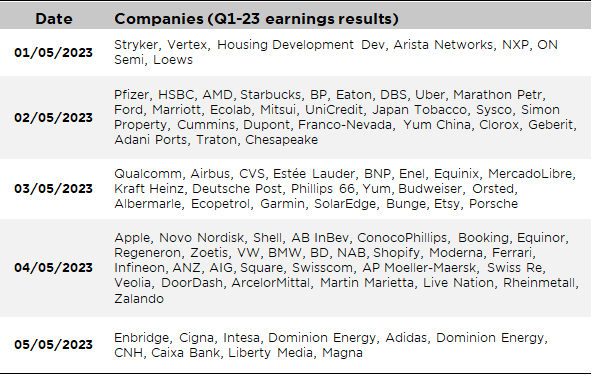
Concluding with the earnings releases (a non-exhaustive table of key earnings release of the week is included at the very end of this email as usual), this week will be packed again, following last week’s US mega tech results, with key companies results. So far, about half of US S&P500 companies have reported their Q1 earnings and they have overall beaten expectation with yoy earnings growth of -5% vs. -8% expected, but, as for the bad market breath, the big 5 MAGMA (Microsoft, Apple, Google, Meta and Amazon) are to a large extent the trees that hide the forest in the same way as the bad market breath as these 5 stocks, which represent cumulatively about 21% of the S&P500, are up circa +30% ytd vs. +2% in average for the rest of the 495 companies of the S&P500.
MAGMA year-to-date volcano eruption in figures
The Big Tech and the overall technology sector, as well as the growth style, have clearly benefitted of the low(er) growth and low(er) rates since the beginning of this year, on top of a very light investors positioning given last year losses on those names. How long this dynamic will last? Not forever I highly suspect. The macro backdrop will certainly become less supportive going forward with either higher for longer rates on the back of more resilient growth and sticky inflation proving more resilient, or a more severe downturn in economic activity that will push investors towards more defensive sectors such as staples, utilities or healthcare.
So, the highlights of this week will continue to be tech earnings with Apple reporting on Thursday, but also AMD tomorrow, Qualcomm on Wednesday or Shopify on Thursday among others. Other noticeable large sectors under the spotlight this week include healthcare (Pfizer, NovoNordisk, Moderna, Regeneron, …), energy (BP, Shell and Equinor in Europe, ConocoPhillips or Marathon Oil in the US), auto (Porsche, Ferrari, VW, BMW and Ford) and consumer-related companies (Starbucks, AB InBev and Kraft Heinz).
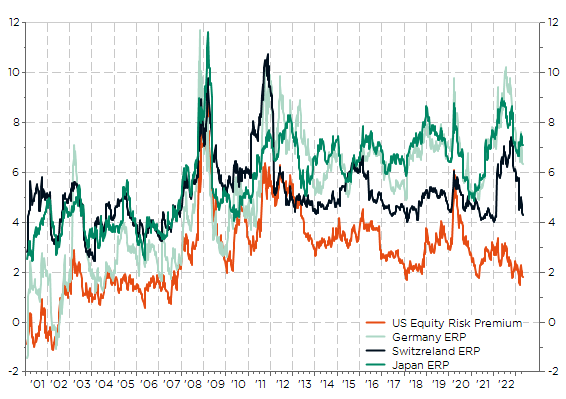
As far equities investors are concerned they will focus on companies forward guidance and cash use, which is declining with capex slowing down and probably less buybacks overall in coming months, on top of costs cutting (especially acute in the tech sector in order to address profitability for the smaller players or earnings growth for the big ones). Anyway, US markets remain at risk of its historical and relative stretched valuations. In particular, its Equity Risk Premium has come back to very low levels while Europe and Japan remain quite elevated. It’s a function of both higher rates and more expensive equity valuation in the US, which is usually the norm I concede … till a certain extent however. In May do what you like, but there are limits not to be exceeded.
Selected Equity Risk Premium (E/P -10y rate)
Economic calendar
This is a marketing communication issued by DECALIA SA. It is neither directed to, nor intended for distribution or use by, any person or entity who is a citizen or resident of or located in any locality, state, country or jurisdiction where such distribution, publication, availability or use would be contrary to law or regulation. The information and data presented in this document are not to be considered as an offer or invitation to buy or sell any securities or financial instruments nor to subscribe to any services. The information, opinions, estimates, calculations etc. contained in this document reflect a judgment at the original date of publication and are subject to change without notice. Investments in any securities or financial instruments may not be suitable for all recipients and may not be available in all countries. This document has been prepared without taking account of the objectives, financial situation or needs of any particular investor. Before entering into any transaction, investors should consider the suitability of the transaction to individual circumstances and objectives. Any investment or trading or other decision should only be made by the client after a thorough reading of the relevant product term sheet, subscription agreement, information memorandum, prospectus or other offering document relating to the issue of the securities or other financial instruments. Where a document makes reference to a specific research report, the document should not be read in isolation without consulting the full research report, which may be provided upon request.
Unless specifically mentioned, charts are created by DECALIA SA based on FactSet, Bloomberg or Refinitiv data.