
- A recession is coming but it is still hard to predict the timing and its severity. A “shallow recession” similar to 2000-2002, but potentially longer, remains my base case scenario
- Don’t expect the Fed to rescue (too) proactively & aggressively economic growth as inflation remains a main issue this time and some “controlled” deleveraging is due anyway.
- However, the collapse of SVB will certainly make the Fed more cautious from now, proceeding in small incremental and “more calculated” steps of 25bps hikes.
- Low growth, sticky inflation and higher rates will still define the macro backdrop going forward
- Pragmatic implications for (bonds) portfolio will be addressed next week. Stay tuned!
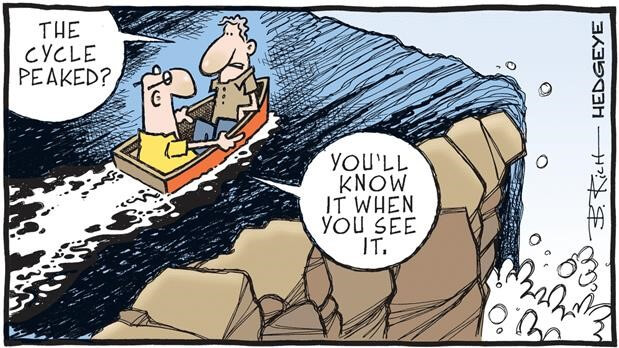
For the last few months, investors have been focused essentially on peak inflation and peak terminal rates, but little attention has been devoted to peak cycle since last summer as the soft landing and even the no-landing scenarios were almost taken for granted. However, the latest events, namely the collapse of SVB (and 2 other US financial institutions with Silvergate and Signature Bank) and the attempt of US regulators to contain the fallout/limit the contagion has certainly propelled some recession concerns back on the frontline.
Many indicators have pointed to an economic slowdown/ US recession since last summer -such as the inversion of the US yield curve or the drop of the 6M % change of the US leading indicators but others have been less worrying so far. In other words, it has been harder than usual to read in tea leaves as far as the growth outlook is concerned, while none of them nor any mix can’t really help us to have a precise clue on the timing and the extent of the slowdown.
US yield curve: recession!
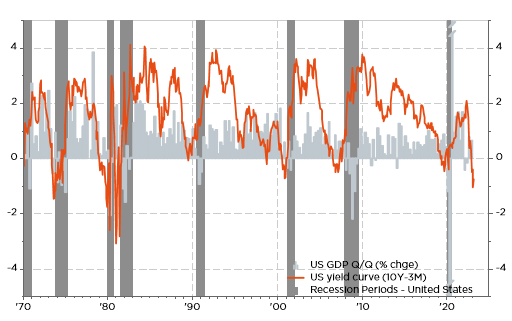
The deep inversion of the yield curve (here above the 10y-3m yield) is often flagged as the most reliable signal of an incoming recession within about 18 months in average (but with a great variability). Note that it is when the curve re-steepens that the recession is usually imminent. That’s when the short end of the curve (3m or 2y rate) come crashing down on speculation the Fed will need to cut rates to support growth. However, with inflation still uncomfortably high, I doubt the Fed will act (too) proactively to sustain growth. The collapse of SVB (2nd largest bank failure in US history) will certainly make the Fed more cautious from now as it gets closer to its terminal rate in order to avoid more financial turmoil, which means that Jay Powell and his crew will likely proceed in small incremental steps of 25bps hikes or even consider a pause eventually, excluding either a cataclysmic awakening of inflation or a severe recession with skyrocketing unemployment rate.
US leading indicators: recession!
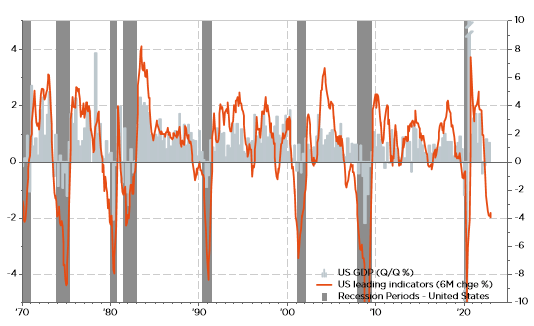
This index of leading indicators relies on “classic” variables and models of the mid-90s, very tilted on the manufacturing activity as a leading indicator of the overall business cycle. I think the sharp drop experienced by this index is somewhat blurred by the current post-pandemic environment (note in the same vein that ISM mfg index has also stayed below 50 for a while now). It certainly points to a slowdown but it doesn’t tell much about its potential severity. My gut feeling is that it’s still possible that the right playbook could be similar of the 2000-2002 recession, which wasn’t so terrible in terms of GDP growth or unemployment rate, but led to a major downward adjustment in some asset prices. With a major difference between today and 20 years ago: back in 2000’s deflation was the major threat, which forced the Fed to act pre-emptively to avoid to fall in a Japanese deflation spiral, while inflation is the main Fed’s issue nowadays, which may prevent them to cut rates (aggressively) to rescue the economy … and potentially reflate some financial prices/exaggeration/bubbles. Especially if unemployment rate doesn’t skyrocket.
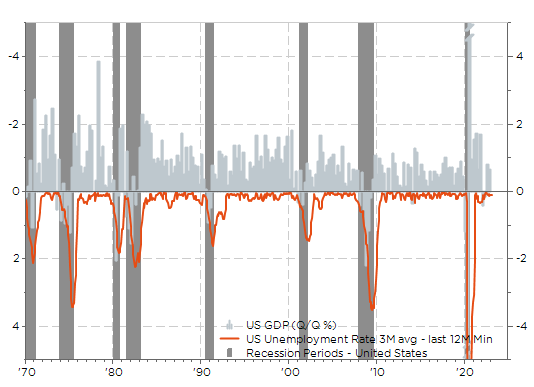
That’s lead us to another recession indicator: the Sahm rule, which identifies signals related to the start of a recession when the 3 months moving average of the unemployment rate rises by 0.5% or more relative to its low during the previous 12 months. With US unemployment rate having likely reached its bottom in January at 3.4%, it means it should reach at least 3.9% (or higher) for 2-3 months. That could happen quite quickly once macro backdrop starts deteriorating -especially when combined with a severe financial crisis- but I doubt again that Fed will panic / blink if unemployment rate would then stay around 4.0%-4.5% for a few months. It’s worth mentioning here that initial jobless claims broke 200k last week and are thus finally moving higher, which suggests the labor market is finally cooling down.
Sahm rule (3 months moving average of the unemployment rate – last 12 months minimum): no recession!
Last but not the least, commercial & industrial loans YoY growth has recently turned south lately but as long as life-blood credit flows into the economy, expansion usually continues… The current financial turmoil may eventually stop credit to feed economic activity for a more or less prolonged period. That’s why functioning financial markets are also part of central bankers’ mandate, but again there are plenty ways to make them work again without having to resort to lowering rates or launching a new QE program… especially when (1) inflation remains an issue and (2) a “controlled” deleveraging (i.e. without too many spillovers contagion effects) in some areas such as housing, cryptos and private markets aren’t certainly seen as a bad thing by monetary authorities.
Commercial & industrial loans growth: no recession… yet

Some distortions arising from the post-pandemic re-opening with a growth rebound led by services when it’s usually the manufacturing sector that shapes the business cycle
A faster than usual tightening that didn’t really let the time to the higher rates poison to filter in the whole economy and financial system
The growing importance of private markets over the last decade, which has also been a major benefiter of the low rates environment. Adjustments are slower and, by definition, less “visible to the public” compared to the traditional (public) markets
Strong wages growth among the low-income bracket… For once money has also flowed directly in the pockets of this category, which has a higher propensity to consume than the Bill Gates or Elon Musk of this world. Furthermore, they have likely no “voluntary” leverage or no other choices to manage it very cautiously. In other words, higher wages growth to low income population have a more powerful economic growth impact than QE…
High nominal growth tends to mislead economic agents in the same way as monetary illusion tends to distort financial decision. It’s harder to have a proper clue on real growth when it is hidden in a large inflation bowl.
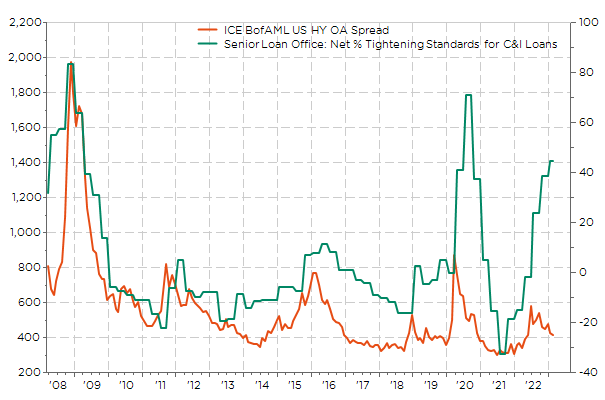
Anyway, some cracks in the US economy have started to emerge. Given the speed and amplitude of Fed’s tightening cycle, and the leverage in some part of the financial system, this kind of financial-market stress was due at some point. To be honest, many investors were feeling somewhat uncomfortable or at least puzzled by the bullish message conveyed by the Chicago Fed National Financial Conditions Index (NFIC) which was still in the easy territory in the face of the hawkish Fed’s action and the collapse in M2 growth. In the same vein, the disconnect between credit spreads and tightening credit standards on the back of immaculate disinflation hopes may now come to an end
Senior loan officers net % tightening credit conditions vs. US HY credit spread: an unusual disconnect that should come to an end now
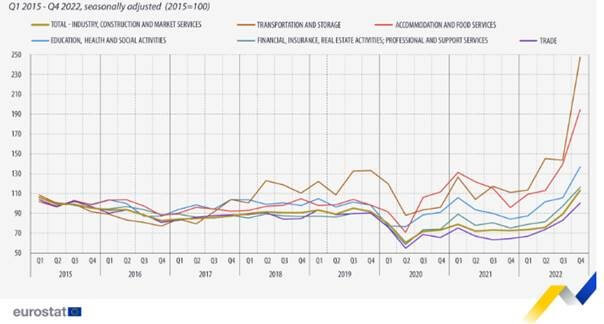
Same stories and conclusion for the European economy, credit market and central bank as illustrated by the graph here below with bankruptcies on the rise.
Declarations of bankruptcies in the EU by activity
So, here are the macro conclusions:
- A recession is coming but it is still hard to predict the timing (it has got suddenly closer since last week) and its severity. Expect labor market to cool down and credit spreads to widen going forward.
- I don’t think we are facing a systemic risk but any big enough idiosyncratic shock may reverberate into the financial system because of the high leverage in some hidden part of the financial system
- We are probably going to see a “shallow recession” according to me (similar to 2000-2002), while inflation in goods and services won’t recede fast enough to allow the Fed to fully rescue growth this time… and indirectly incite speculators to re-leverage.
- Low growth, sticky inflation and higher rates will thus still define the macro backdrop
What are the lessons to be learned? What does this mean pragmatically for the management of your (bond) portfolio? As I am running out of time and space, it will be the topic of the next week letter.
Economic calendar
The agenda will once again be packed this week with the US CPI (tomorrow), ECB meeting (Thursday) and an array of economic activity indicators (retail sales, industrial production, housing) from tomorrow onwards. If you feel like me somewhat annoyed because economic nodes seem piling up faster and faster and becoming more intricate with time, I highly recommend you this video of Garcimore (the most funny magician of my youth) : you will eventually laugh and at worst you will learn how to get rid from nodes while remaining “décontrasté” even when “il/ça m’énerve”.
Along with relatively strong job numbers seen last week and Powell’s hawkish rhetoric during his testimony in front of the Congress, the release tomorrow of US February CPI may have tipped the balance for a 50bs rate hike by the Fed on March 22th in case of a much stronger than expected report. However, the recent fiasco of SVB (2nd largest bank failure in US history) will certainly make the Fed more cautious from now as it gets closer to its terminal rate (in order to avoid more financial turmoil). In other words, Jay Powell and his crew will likely proceed in small steps of 25bps hikes excluding a cataclysmic awakening of inflation. Anyway, tomorrow CPI reading will be scrutinized in order to assess the progress (or not) of the disinflationary trend. Headline and core inflation are expected to rise about 0.4%-0.5% MoM -about the same pace of the prior month-, causing both YoY readings to tick down towards 6.0% and 5.5% respectively from 6.4% and 5.6%. Readings which remain uncomfortably high for the Fed but still consistent with gradual disinflation. Note also that Fed members are now in a blackout period (until their next meeting).
The other key event for investors this week will be the ECB decision on Thursday. Actually, we can already jump to the conclusion: ECB will hike by +50bps for a 3rd time in a row to bring deposit rates at 3% on the back of upside surprises from recent inflation readings across the Euro area as well as generally stronger than expected economic data. Lagarde will certainly maintain the guidance to “stay the course in raising rates significantly at a steady pace”, leaving therefore the door open (but not commit as strongly this time) for an additional +50bps in May. After that, there should be a downshift in June to +25bps (if not in May assuming inflation pressures start receding soon), taking the terminal deposit rate in the 3.75%-4.00% are by the end of the summer.
As far as Asia is concerned, investors will keep a close eye tomorrow on China retail sales, industrial production and fixed assets investment data for February. Consensus expectations are pointing to a strong rebound in retail sales on the back of reopening and Chinese New Lunar Year festivities, while industrial production expansion should continue at a moderate pace. Investors will also look at the first results of the Japanese “shunto” wage talks by the end of the week, with wages forecasted to grow by 3.5%… a pay hike not seen over the last 20 years!
Turning back to the US to conclude, other notable economic reports include
- February retail sales data on Wednesday. The consensus expects a pullback/contraction after last month’s strong +3.0% reading, which will be more in line with the overall cautious guidance from most US retailers. Another useful signal to gauge consumers’ willingness to spend may come from FedEx’s and Dollar General’s earnings due Thursday.
- The preliminary reading of March University of Michigan’s sentiment on Friday. While there shouldn’t be a major variation in the headline index, the survey inflation expectations, assessment of the job’s market and the prospects for big ticket spending will also be in focus.
- The NAHB housing market index for March on Wednesday and February housing starts and building permits on Thursday. Tentative signs of stabilization are expected as US long term rates peaked last October.
- The industrial production data for February on Friday (consensus expects a rebound of +0.4% after some weakness experienced in the prior 3-4 months), as well as the regional manufacturing indices for March with the Empire State tomorrow and the Philadelphia Fed on Thursday, which will feed our ISM mfg model.

This is a marketing communication issued by DECALIA SA. It is neither directed to, nor intended for distribution or use by, any person or entity who is a citizen or resident of or located in any locality, state, country or jurisdiction where such distribution, publication, availability or use would be contrary to law or regulation. The information and data presented in this document are not to be considered as an offer or invitation to buy or sell any securities or financial instruments nor to subscribe to any services. The information, opinions, estimates, calculations etc. contained in this document reflect a judgment at the original date of publication and are subject to change without notice. Investments in any securities or financial instruments may not be suitable for all recipients and may not be available in all countries. This document has been prepared without taking account of the objectives, financial situation or needs of any particular investor. Before entering into any transaction, investors should consider the suitability of the transaction to individual circumstances and objectives. Any investment or trading or other decision should only be made by the client after a thorough reading of the relevant product term sheet, subscription agreement, information memorandum, prospectus or other offering document relating to the issue of the securities or other financial instruments. Where a document makes reference to a specific research report, the document should not be read in isolation without consulting the full research report, which may be provided upon request.
Unless specifically mentioned, charts are created by DECALIA SA based on FactSet, Bloomberg or Refinitiv data.