
- It ain’t over ‘till it’s over: Cagliari Calcio will play in Serie A next year thanks to an incredibly miraculous goal at the last minute.
- Unexpected reversals of previous trends or correlations also happen in financial markets
- Why the economy has proved more resilient than expected so far?
- Why equity markets, and in particular mega tech growth stocks, have done so well recently despite bouncing back long rates?
- Is this time different? Actually not, it’s just more complex than usual
Cagliari Calcio finally made it to qualify for Serie A next season by beating Bari yesterday evening with an incredibly miraculous goal at the 94’, which turned into a freezing kill-joy for the 60’000 attendees of the San Nicola stadium. As Yogi Berra would say: it ain’t over ‘till it’s over! For sure, it looks like a typical Sardinian robbery after the disastrous first round season of Cagliari. However, the last few months have been much more successful for my favorite Italian soccer team, which benefitted from a favorable momentum, a seasoned and inspiring coach (Claudio Ranieri) and… very little pressure as the odds were definitively against them at the start of 2023.
It’s not just in sport that we sometimes see unexpected reversals of previous trends or correlations. Just look at the financial markets or the economy! Despite higher policy rates and overall still elevated bond’s yields, which recently bounced back, most of us have been puzzled by the overall resilience of both economic growth and equity markets so far, if not caught literally off guard by the outperformance of growthy mega tech stocks year-to-date despite this higher for longer rates context.
Concerning the economy, while there have been several warning recession signals flashing red about an incoming recession over the last 12 months such as an inverted yield curve or an ISM mfg index below 50, nothing has happened yet… In particular, the US, as well as the EU economy, have proven so far much more resilient than expected to higher rates. BoC and RBA also surprised investors recently with unexpected hikes on the back of stickier inflation and more resilient growth than expected. For sure, the manufacturing and real estate sectors are suffering from monetary policy tightening, but their drag to overall GDP has been largely offset by a strong support from the services component on the back of post-covid normalization and households’ consumption thanks to a tighter than usual job market, plus an increase in real disposable income this year as wages have picked up while inflation has receded compared to last year peak. Another key factor explaining why higher rates aren’t biting faster or deeper yet to growth is the strong private sector balance sheet with the excess saving accumulated by households, which is gradually depleted but could last until mid-2024 (see graph below), and large cap companies, which benefitted from very favorable financing conditions during the covid to extend their debt maturity profile at ridiculously low levels. In other words, they won’t really face a wall of debt in the near term and they now doubly benefit from a higher inflation as it mechanically lowers their real debt burden and it inflates their nominal earnings growth, not mentioning eventually some “greedflation” for the most successful ones benefitting from pricing power.
US households’ excess savings: still $900bn of firepower to spend

As far as the financial markets are concerned, another key surprise this year has been the resilience of equity markets, led by the impressive outperformance of growth vs. value style in regard to the rates context, in particular recently with rates bouncing back. Over the last 10-15 years, rates have been a key driver of tech and overall growth stocks relative performance, but the relation seems to have broken down this year.
Equity markets no longer fear rising (real) rates

Source: GS
I see several reasons behind these unexpected trends:
- Investor positioning: investors entered into 2023 in a bearish cautious mode, with an overall light positioning, an underweight in tech mega cap and other growth stocks. It also means investors had and still have plenty of dry powder. According to the latest BofA Merrill Lynch survey of managers, cash represents circa 6% of the portfolio, up from less than 4% in late 2021, and still near the historical high.
- Lower valuations and better/improving EPS growth: last year unexpectedly fast rise in rates tanked first unprofitable tech and then spread to mega tech/overall growthy stocks in the 2nd part of the year. The latter benefitted from stronger balance sheet, but they also acted swiftly to cut costs (firing people, reduce or close non-profitable units) and thus defend their high profit margins. As a result, their EPS growth prospects have been revised higher recently vs. relatively flattish/slightly down for the rest of the market
- AI narrative has naturally added a cherry on the cake for mega-tech stocks
- Falling inflation/near peaking rates: in economy as well as for markets, it’s not only the level of key variables that matters but also the trend. In this context, we have to admit that (1) long term bond’s yield haven’t increased further compared to last October peak and (2) there has been an ongoing disinflation process year-to-date. That’s also why equity-bond return correlations have turned negative again, even for longer duration Nasdaq.
- Slower economic growth: in a context of lower growth, with increasing recession risks and tighter credit condition, companies able to deliver above average growth, with defensive characteristics and strong balance sheets usually trades at a higher premium.
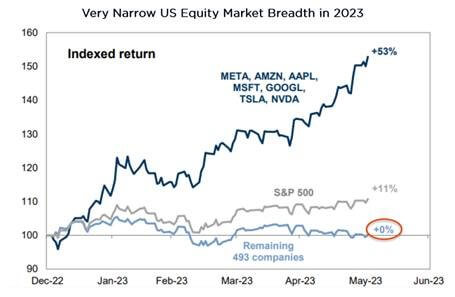
Recent equity rally is driven by just a few mega caps…
Source: GS
Excluding mega-cap AI-related tech stocks, the S&P500 index would be flat since the start of the year. We observe a similar pattern in EU equities with just a few “growthy” stocks, especially luxury-like names or the GRANOLAS (Glaxosmithkline, Roche, ASML, Nestle, Novartis, Novo Nordisk, L’Oreal, LVMH, Astrazeneca, SAP) to use an acronym coined by GS, driving the indices YTD returns. Is this incredibly narrow leadership a red flag? Not necessarily according to past experiences but it tends to confirm and fit into our own narrative about limited upside potential for the overall equity indices. In fact, the S&P500 as well as several equity indices are currently at the same level as they were in August last year as investors continue to reassess and balance the tug of war outcome between stickier inflation, higher rates and recession odds. While on the surface it may seem different this time, it’s actually not. I mean, markets and investors are reacting as expected… with the rearview insights unfortunately. It’s just they are facing a more unusually complex context.

Economic calendar
Central banks will take center stage this week with the Fed, ECB and BoJ meetings on Wednesday, Thursday and Friday respectively. While investors consensus believes the Fed may stay put this time (circa 25% probability of a hike on June 14) and eventually hike at its next meeting at the end of July (2/3 probability), much will certainly depend on the US May CPI, which will be released tomorrow. The consensus expects headline and core CPI to increase +0.2% and +0.4% MoM respectively, bringing down the YoY headline inflation to 4.1% from 4.9% and the core to 5.2% from 5.5%. A reading in-line with the consensus would certainly allow the Fed to “skip” this meeting, and wait for more data to assess the situation before eventually hike again to tame further stickier inflationary pressures/expectations if needed. As the FOMC meeting will also be accompanied with the latest Summary of Economic Projections (SEP) and the dots plot, all eyes will be on how much support there is for further tightening among officials this year… as well as their views on timing and extent of rate cuts thereafter.
Other noticeable US economic data releases include the NFIB Small Business Index tomorrow (keep an eye on willingness to hire, plan to increase wages and overall credit conditions on top of the headline figure), May PPI on Wednesday, weekly initial jobless claims, May retail sales and industrial production and June Empire State & Philadelphia Fed manufacturing indices, which will all be released on Thursday. Modest monthly gains are expected for both retail sales and industrial production, as well as some slight improvement in regional manufacturing sentiment gauges. Finally, we will get the June preliminary reading of University of Michigan Consumer Sentiment on Friday, with labor market related questions (easy to find a job or not) and inflation expectations especially in focus after the gauge for the next 5-10y climbed to 3.1% last month.
Turning to Europe, the ECB will take the lead from the Fed on Thursday, with another +25bps hike widely expected. According to ECB members latest speeches and markets consensus, it should then be followed by another +25bps hike in July that would take the terminal deposit facility rate to 3.75%, but the release of ECB economic and inflation projections may help investors to assess the risk of further tightening after the summer and/or a “stickier” hawkish ECB stance going forward. As a result, it’s fair to expect President Lagarde to guide toward further rate hikes during the press conference, supported by slight hawkish changes to macro projections (broadly unchanged growth forecasts and higher near-term inflation forecasts). In Germany, June ZEW Economic sentiment will be released tomorrow and Eurozone final CPI reading for June will be available on Friday. Headline and core indices are likely to be confirmed at the flash estimates of 6.1% and 5.3% YoY respectively, but the focus will be more on the item-level breakdown (especially the services component, which is much more labor intensive).
In Asia, we will get China’s key activity indicators for May on Thursday, including industrial production, retail sales and fixed investments (with the breakdown between real estate, infrastructure and manufacturing). After recent disappointing data releases and lack of any inflationary pressures, this set of data may be crucial for both investors to validate or not the current pessimism surrounding the China market and weak recovery, as well as for the government, which may also step in with more aggressive stimulus at some point. Finally, the BoJ meeting will conclude this busy week for central banks on Friday. Basically, no change is expected, especially as there won’t be economic projections forecasts, but investors will look for any hints through statement and follow-up speech to reassess probability and timing of a potential policy shift. In this context, we see some non-negligible probability of a change in the yield curve control at the next BoJ meeting on July 28th (either by allowing a wider band for the 10y rate or, more likely, by targeting the 5y JGB yield instead) consistent with an outlook report, which should thus incorporate a higher inflation trajectory going forward.
Last but not the least, your humble servitor as well as his colleague Jonathan Grass (lead manager of Decalia Circular Economy equity fund), will participate to the Swissquote Trading Day on Thursday. Click on the link Swissquote Trading Day 2023 : Conférences live et online for the agenda & (free) registration either live at the Bâtiment des Forces Motrices in Geneva or online.

This is a marketing communication issued by DECALIA SA. It is neither directed to, nor intended for distribution or use by, any person or entity who is a citizen or resident of or located in any locality, state, country or jurisdiction where such distribution, publication, availability or use would be contrary to law or regulation. The information and data presented in this document are not to be considered as an offer or invitation to buy or sell any securities or financial instruments nor to subscribe to any services. The information, opinions, estimates, calculations etc. contained in this document reflect a judgment at the original date of publication and are subject to change without notice. Investments in any securities or financial instruments may not be suitable for all recipients and may not be available in all countries. This document has been prepared without taking account of the objectives, financial situation or needs of any particular investor. Before entering into any transaction, investors should consider the suitability of the transaction to individual circumstances and objectives. Any investment or trading or other decision should only be made by the client after a thorough reading of the relevant product term sheet, subscription agreement, information memorandum, prospectus or other offering document relating to the issue of the securities or other financial instruments. Where a document makes reference to a specific research report, the document should not be read in isolation without consulting the full research report, which may be provided upon request.
Unless specifically mentioned, charts are created by DECALIA SA based on FactSet, Bloomberg or Refinitiv data.