
It took 34 years, 2 months and 20 something days… but it finally made it. The Japan Nikkei 225 stock index posted indeed a new all-time high (ATH) last week, snapping symbolically one of the longest journeys through the disdain of global investors, but also breaking somewhat off my favorite provocative question to investors looking at the fixed income universe with contempt: i.e. “What’s the time to recovery of the Nikkei 225?” Apart from the symbol and my joke now falling flat, I will try to go through the key reasons supporting this renewed interest in Japanese equities and why the sun may continue to shine on them.
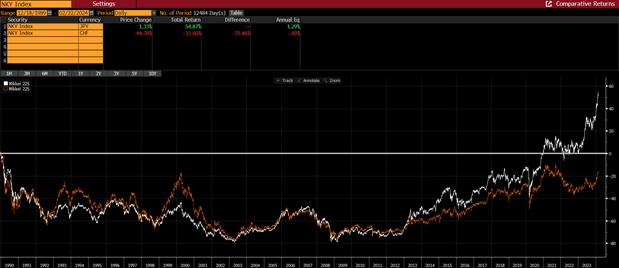
Given the methodological flaws of the Nikkei 225 (it’s a price weighted index, not a capitalization weighted one), evil tongues may still refer to the Topix index, still a little short of a new ATH (circa -8% below its December 1989 record of 2’884.8) or even worse, or better, depending on the way you look at it, the Topix Bank Index, which after soaring 100% over the last 18 months remains nevertheless -75% below their previous peak at the end of 1980’s. It’s also worth mentioning to be completely fair and transparent that the Nikkei 225 breakthrough happened actually in December 2020, when considering also the re-invested dividends, while it is still short of about -15% or -45% in CHF. With or without dividends.
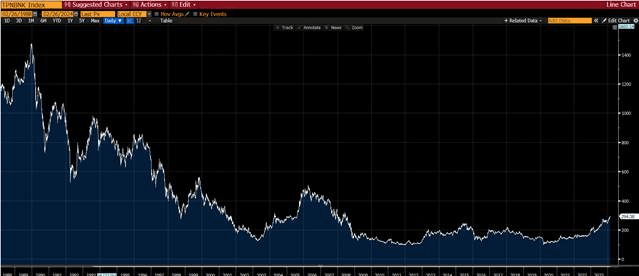
Topix Bank Index since 1988
Nikkei 225 Total Return in JPY and CHF since December 1989
How to interpret this comeback of Japanese equities and how long can it last (this time)?
While the JPY weakness has indubitably been of some help lately and more generally over the last decade, actually since the late premier Shinzo Abe’s so-called Abenomics plan started in early 2013 (at that time JPY was around 80 against USD vs 150 today), it doesn’t rely only on that. In fact, there are 3 main drivers or catalysts in my views, which have come together just at the right time: a favorable macro backdrop with the return of inflation, cheap valuations and improvement in corporate governance.
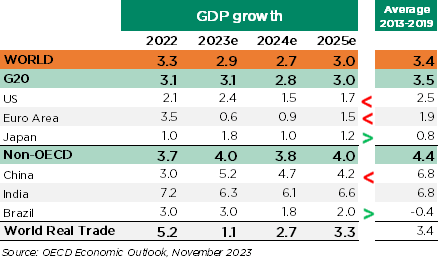
Let’s start with the macro: which is the only economy that could seriously welcome the return of inflation? Especially as it didn’t really spike but just returned somewhat above BoJ’s target after more than two decades of continuous fight against deflation. Moving out of deflation is turning everything upside-down for the best: wages are growing (and thus consumer spending is on a better footing now), companies are regaining some pricing power on top of confidence (so they are probably keen to invest), banks are now benefitting, thanks to higher interest rates, from the huge pile of cash accumulated in their clients’ deposits, a restrictive monetary policy became instantly an easy one thanks to positive inflation, etc… While economic growth forecasts for this year and next remain far from spectacular, it’s important to note that Japan is among the few DM economies where growth prospects look better than the previous decade (suffice to remember how many times Japan experienced a technical recession since 2010?… Three, not including the pandemic-related one!).
OECD growth projections (Nov 2023)
Let’s move to valuations, it’s indeed the long-used argument from structurally bullish investors on Japan but it has never really worked as well as recently… because value investing doesn’t work in a deflation/anemic growth scenario! Return of positive inflation and rates, resolutely accommodative monetary policy, a weak currency and improving growth prospects all translated into last year +15% Japanese EPS growth whereas the rest of the world oscillated between flattish and negative figures. From value trap, some Japanese equities suddenly turned up to be real value opportunities as spotted by Warren Buffet (he again endorsed Japan trading firms in his last letter to investors). In the meantime, longtime dismissed Japanese banks have soared more than 100% since the summer 2022!?
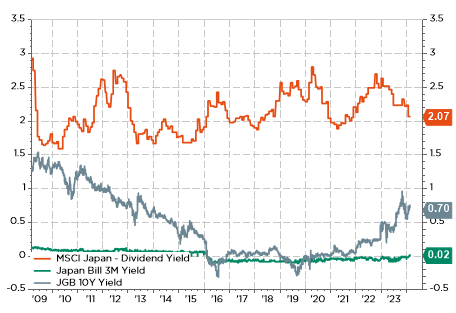
Japan cash, bonds and equities (dividend) yields: TINA has survived in Japan! And it is really making sense now thanks to the rebound of nominal growth in positive territory, the easy financial conditions and the TSE reforms
Finally, the 3rd arrow of the Abenomics – a growth strategy that stimulates private investment- has also played (and it’s still playing) a key role, through the credible and profound Tokyo Stock Exchange (TSE) reforms, which have led, among others, to
- A return of cash to investors through record share buybacks
- A larger interest, and greater scrutiny, from global investors thanks to improved transparency and simplification (read consolidation), which have therefore contributed to the much-needed elimination of zombies’ companies …or their behavior at least.
- A larger interest from domestic retail investors though fiscal incentives (new tax-sheltered individual savings accounts known as NISA)
As a result, what’s happening on the Japanese equities, it isn’t hype attracting foreign investors (dumbed sometimes as “the tourists” by Japanese equity fund managers), the JPY weakness or the Chinese woes triggering reallocation in favor of Japan (and India). In fact, there are clear and strong underlying fundamentals supporting this investment case.
Unfortunately, the easy part if now probably behind us. I suspect indeed that the day when BoJ will get out of its negative interest rate policy and abandon the yield curve control (likely by end of April in my opinion when the Shunto -wages negotiations- results will be known and the BoJ will also publish its updated outlook report), it will mark symbolically the end of the sunrise… And perhaps also a revenge of the JPY. Anyway, there are still plenty of time before the dusk.
Economic Calendar
This week, investors focus will be on inflation as well as on business sentiment across the major economies, with most data releases backloaded towards the end of the week, while the US earnings season is now winding down as more than 450 of the S&P500 companies have already reported.
Starting with the US, the key highlight will be the US Personal Consumption Expenditures (PCE) deflator for January that will be released on Thursday along the personal income, spending and saving rate data. The consensus expects some acceleration with monthly increases of +0.3% and +0.4% for headline and core PCE deflator (the Fed’s favorite inflation gauge) respectively vs. +0.2% and +0.3% the prior month. However, the annual inflation rates are expected to remain broadly unchanged, still somewhat higher than the Fed’s 2% target (headline ticking up to 2.6% vs. core ticking down to 2.8%). Other noticeable US data releases include the January preliminary durable goods orders, the Conference Board’s consumer confidence index (tomorrow) and the US ISM manufacturing index for February on Friday. For a reminder, our proprietary model forecasts a rebound above 50 (vs. 49.1 observed last month) for the first time since June 2022…
Inflation will also be in focus in Japan with the release of January CPI tomorrow (deceleration for both headline and core annual inflation is expected), as well as in Europe with the preliminary CPI prints for February for both Germany and France due on Thursday. Other important releases outside the US include the final readings of February manufacturing PMI (Purchasing Managers Index) across the major economies on Friday, and especially the China Federation of Logistics and Purchasing (CFLP) Mfg & Non-Mfg Purchasing Managers PMI in order to monitor Chinese progress on growth (if any) and the potential impact (or not) of the Lunar New Year holiday. On top of these economic data releases, there will be also a fair degree of central bankers’ speeches and interviews, which may impact expectations about the timing of the first rate’s cuts (now expected rather in June).
To conclude with companies Q4-2023 earnings releases, we will get the results from Salesforce, Dell Snowflake, HP or Autodesk in the Tech space; Lowe’s, TJX, Ross Stores among the US retailers; or Puma, Ferrovial, Universal Music, Holcim, Leonardo and AB InBev, among others, in Europe.

This is a marketing communication issued by DECALIA SA. It is neither directed to, nor intended for distribution or use by, any person or entity who is a citizen or resident of or located in any locality, state, country or jurisdiction where such distribution, publication, availability or use would be contrary to law or regulation. The information and data presented in this document are not to be considered as an offer or invitation to buy or sell any securities or financial instruments nor to subscribe to any services. The information, opinions, estimates, calculations etc. contained in this document reflect a judgment at the original date of publication and are subject to change without notice. Investments in any securities or financial instruments may not be suitable for all recipients and may not be available in all countries. This document has been prepared without taking account of the objectives, financial situation or needs of any particular investor. Before entering into any transaction, investors should consider the suitability of the transaction to individual circumstances and objectives. Any investment or trading or other decision should only be made by the client after a thorough reading of the relevant product term sheet, subscription agreement, information memorandum, prospectus or other offering document relating to the issue of the securities or other financial instruments. Where a document makes reference to a specific research report, the document should not be read in isolation without consulting the full research report, which may be provided upon request.
Unless specifically mentioned, charts are created by DECALIA SA based on FactSet, Bloomberg or Refinitiv data.