
The latest US employment report put a dent in the Fed’s pivot narrative with somewhat higher than expected nonfarm payrolls (+199k, in line with the last 6 months average) and, more importantly, a lower unemployment rate (-0.2% to 3.7% in November).
Indeed, this decline in unemployment rate invalidated, at least theoretically, a recession signal from the Sahm rule of thumb indicator: when the 3M moving average of the unemployment rate rises by at least +0.5% relative to the minimum of the 3M average from the previous 12 months, a recession then occurs.
Sahm Rule Recession Indicator: Not yet there!

Furthermore, the participation rate ticked up to 62.8% and the average hourly earnings rose +0.3% mom (sill running at 4.0% yoy, but easing at a more comfortable 3.4% a.r. over the last 3 months). As a result, while this job report cemented expectations that the Fed’s hiking cycle is over, it also dialed back hopes of an imminent pivot/rate cuts at this stage. In the context of a soft landing, market expectations about 4-5 Fed’s rate cuts still seem exaggerated according to my view.
Implied policy rate & number of hikes/cuts priced by Fed Fund Futures

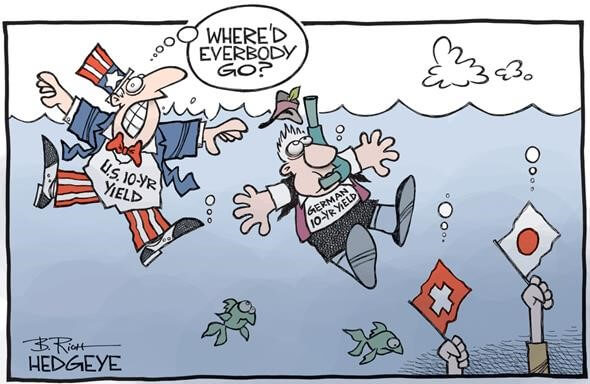
So, if you think, like me, the US Treasuries have likely run too fast and/or too far and therefore you don’t foresee US 10y yield to go much lower in the next few months (let’s say it would stay around 4% next year); or if you have missed the sharp decline in Swiss 10y bond’s yield last month (currently sitting around 0.7%), here is perhaps a way to keep (diversify) or add some duration exposure with an extra yield, a top AAA credit quality and… without any currency risk.
Consider indeed the Australian government bonds yield curve: it offers a slight positive slope with 2y and 10y rates at 4.03% and 4.33% respectively, compared to 4.74% and 4.25% for the 2y and 10y US Treasuries & 1.1% and 0.7% for Swiss government bonds of the same maturity. As a result, you may benefit from the difference in yield curve slope (most of DM yield curves are now inverted, excepted Japan and Australia) by investing in a 10y Australian government bond and hedging the currency risk by selling forward the AUD vs. the USD or the CHF if you are a Swiss based investor.
Boost your duration’s yield with Australian government bonds
AUD and USD sovereign curves

So, get out your calculators! Hedging AUD for the next 12M brings an additional carry of 0.75% for USD investors, while it will cost -3.02% for a CHF investor. As a result, the Australian 10y government bond offers a yield in excess of 5% converted in USD (4.33% + 0.75%) or 1.3% in CHF (4.33% – 3.02%) for the next 12 months. In a scenario where rates stay quite stable in 2024, you will thus benefit from both a higher carry and a positive roll-down effect, without currency risk and with a solid AAA name (general public debt to GDP < 60%).
Some investors may consider that the yield’s jump is not really kangaroo worthy, but when you’re dealing with leaps, as well as with fixed income management, there’s another aspect that shouldn’t be overlooked… the balance. In this context, adding a pinch of AUD sovereign bond’s duration may help you. Like the kangaroo’s tail, it may offer a support to fixed income portfolio returns next year (to lean on, push off and eventually extend the rebound). Whereas kangaroos use their tail as an extra leg, fixed income managers should perhaps use kangaroos for their extra yield.
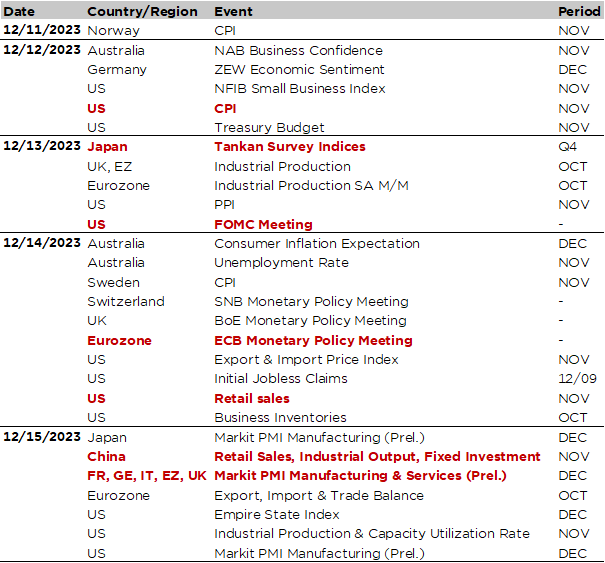
Economic Calendar
Central bankers will be under the spotlights as several major central banks will meet this week (Fed, ECB, BoE, SNB or the Norges Bank) with decisions on current policy rates but also insights about their future trajectory through their updated projections on growth, inflation and long term (neutral) rates. While these central banks meetings be center stage, it will be worth to keep also an eye on a few key data, such as the US CPI report for November (tomorrow), the US retail sales (Thursday), or the release of the global PMI indices for December (Friday).
While it is widely expected that the Fed on Wednesday, as well as other central banks (ECB, BoE and SNB) the day after, will keep rates on hold for their last meeting of the year, investors will scrutinize the statement, the quarterly summary of economic projections (here is the latest one from September) – including the dot plot- and the Powell’s speech -incl. the Q&A with journalists- that will follow in order to detect any insightful clues about the trajectory of policy rates going forward. Given the latest markets actions (significant easing of financial conditions), economic data still pointing to growth resilience/firm labor market and investors’ expectations already pricing 4-5 rates cuts next year, we should expect a rather “hawkish hold” stance from Powell, who will likely continue to push back -for the time being- against the idea of a pivot soon. In other words, the hiking cycle is over (barring an unexpected surprise) but it’s premature to talk about rate cuts at the moment.
Speaking about potential surprise, keep in mind that the Fed’s rate decision will be preceded by the US CPI report for November (tomorrow). The consensus expects headline CPI to remain unchanged compared to October (0.0% MoM) and core CPI accelerating to +0.3% (+0.2% in October), which will broadly annual inflation rate unchanged at 3.1% and 4.0% for headline and core one respectively. Apart that, we will also get from the US the NFIB Small Business Confidence index (tomorrow), the US retail sales (Thursday) and the industrial production (Friday) for an updated broader assessment of the US economic activity in November. According to the consensus, these data should point to a stabilization with little changed expected compared to the previous month.
In Europe, the ECB, the BoE and the SNB are also widely expected to keep their target rates on hold at respectively 4.0%, 5.25% and 1.75%. While headline inflation across Europe has recently surprised on the downside, core inflation has proven somewhat stickier and labor markets remain tight (historically low unemployment rate wit quite elevated participation rate). As a result, ECB and BoE will likely also keep a hawkish tone, but somewhat more conciliant that the Fed, compared to investors’ expectations about a more dovish outcome in the very near future. Only the SNB have some good reasons to not lean on the hawkish side as (1) inflation has already fallen back below 2% as it didn’t really sky-rocket neither and (2) the ongoing CHF strength is keeping at bay imported inflation, while making Swiss exporters life still more difficult, especially in a context of desperately weak German industry. As a result, we can’t rule out that the SNB may eventually be the first major central bank to cut rates next year (as soon as in March).
Zooming out to the rest of the world, the Japan quarterly Tankan business survey (Wednesday), China November economic activity data (industrial production, retail sales and fixed investment) and the global flash December PMI indices (Friday) will bring some additional light on global growth momentum. The focus will likely continue to be on the trajectory of growth improvement in both Europe and China as illustrated by the rebound in Citi Economic Surprises Index for these regions lately (they remain however in negative territory). In Germany, we will also be the ZEW survey tomorrow, while China will hold its Central Economic Work Conference over the next few days after the Chinese Communist Party Politburo took place last Friday. According to the statement, “proactive” fiscal policy (rather than monetary policy) will support economic activity next year in China.
This is a marketing communication issued by DECALIA SA. It is neither directed to, nor intended for distribution or use by, any person or entity who is a citizen or resident of or located in any locality, state, country or jurisdiction where such distribution, publication, availability or use would be contrary to law or regulation. The information and data presented in this document are not to be considered as an offer or invitation to buy or sell any securities or financial instruments nor to subscribe to any services. The information, opinions, estimates, calculations etc. contained in this document reflect a judgment at the original date of publication and are subject to change without notice. Investments in any securities or financial instruments may not be suitable for all recipients and may not be available in all countries. This document has been prepared without taking account of the objectives, financial situation or needs of any particular investor. Before entering into any transaction, investors should consider the suitability of the transaction to individual circumstances and objectives. Any investment or trading or other decision should only be made by the client after a thorough reading of the relevant product term sheet, subscription agreement, information memorandum, prospectus or other offering document relating to the issue of the securities or other financial instruments. Where a document makes reference to a specific research report, the document should not be read in isolation without consulting the full research report, which may be provided upon request.
Unless specifically mentioned, charts are created by DECALIA SA based on FactSet, Bloomberg or Refinitiv data.