
- “Prediction is very difficult, especially if it’s about the future” (Niels Bohr), which has been particularly true for inflation over the last two years. It’s unwise to depend solely on a single indicator or a multi-variable model, as the economic landscape is ever-changing.
- The present economic structure, marked by a growing importance of the services sector, globalization, an aging population, among others, is vastly different from that of 50 or even 20 years ago. Consequently, a variable or model that worked in the past may become less effective or less suitable over time.
On inflation there has recently been a mea culpa by some major central banks. In the current economic situation, which indicators (including unconventional ones) can be considered most valid for predicting inflation?
“Prediction is very difficult, especially if it’s about the future!” (Niels Bohr) and even more for inflation nowadays. Like many other key variables, you can’t rely only on a single indicator or on a single model using multiple variables because the backdrop evolves. Current economic “structure” is very different than 50y or even 20y ago: more services less manufacturing, globalization, ageing population for example among key long term trends that shape gradually an economy. As a result, a variable or even a model that worked in the past tend to become less powerful or less appropriate over time. As far as inflation is concerned here are a non-exhaustive list of set of variables to consider.
•Economic Activity : GDP Growth, industrial production, PMI indices, economic surprises, new orders, inventories,…
•Input prices: Energy prices (as it also drives inflation expectations), producer prices, import prices, PMI or ISM prices paid component, Supply Chain Pressure Index, Transportation costs (Baltic Dry Index), currency movements,…
•Labor market: unemployment rate, jobless claims, survey, ISM employment component, participation rate, jobs opening, job quits, NFIB survey (plans to increase employment, job positions not able to fill right now), Consumer survey question about difficulty to find a job, average and median wages, employment cost index, productivity,…
•Monetary Policy: M2 growth, velocity of money, demand for loans, currency appreciation/deprecation, nominal and real interest rates,…
•Inflation Expectations: breakeven inflation on Inflation-linked bonds, consumer inflation expectations,…
Then the next key questions will be: do I need to transform these variables (year-over-year % change, normalization, 3M % change,…), are the relation linear with inflation, are there some lags, are there some thresholds or dummy variables, etc…?
Exhaustive models can be thus very complex but at the end they don’t add to much value, especially for investors when you consider that data are released with a lag (for example, the 1st estimate of quarterly GDP is released 6 weeks after the end of the quarter!?). So, a summary dashboard can be more useful for investors in order to assess if inflationary pressures are trending up and down in the near term, while central bankers often need a precise figure in a more distant future (always wrong obviously given the uncertainty as the time frame grows). That’s why sometimes they prefer fan charts (BoE uses them a lot) but then it’s less straightforward to draw a clear-cut conclusion if you have a large range of possible outcome.
M2 money supply numbers in the 1970s were widely used to explain price trends. Are they still valid now or not? And in which areas (EU, US, China, etc.)?
It is part of the set of indicators economists should have a look too but it isn’t reliable enough in stand-alone. Just look at the graph here below:
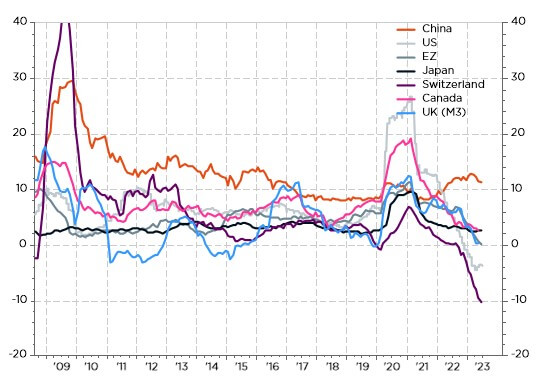
After the GFC in 2008, M2 exploded but we didn’t observe any inflationary pressures… in good & services (fiscal policies were too restrictive, consumers and companies had to deleverage, commodities prices collapsed, unemployment rate soared, etc…). Same M2 sky-rocketing pattern post-pandemic, but, this time, inflation jumped to level not seen since the 80’s !?
Now look at the country level: M2 growth has been accelerating only in China over the last year, but China inflation remains very low and the lowest among these selected economies, while inflation has remained stubbornly high in the other economies despite a sharp slowdown of their M2 growth (and even a contraction for a few ones). So it’s far to be a relevant indicator when you consider it in standalone.
It’s also worth mentioning that while the ECB and especially China monetary authorities continue to monitor M2 growth and credit growth overall, the Fed seems to have put this variable in the dustbin as it’s a very long time that Fed members haven’t made any references or spoken about money supply growth.
Which indicators used to interpret the current economic situation and the performance of the financial markets do you consider unreliable? Which signals should be looked at instead?
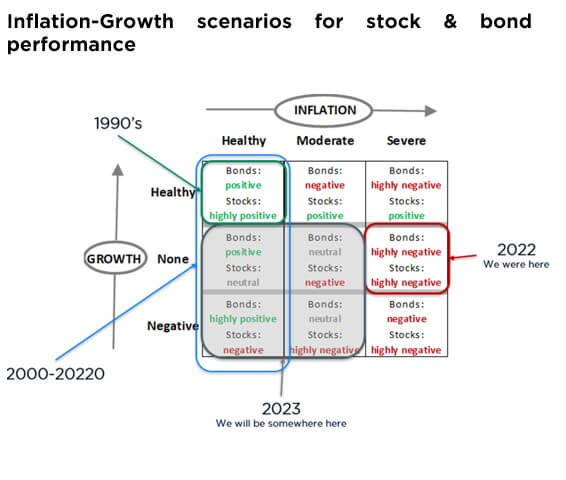
The 3 pillars to interpret the business cycle and markets reaction are economic growth, inflation and economic policies (i.e. monetary policies most of the time even if we have experienced a greater influence of fiscal policies since the Covid-19 pandemic.)
It’s not only the “level” (good/bad) that matters but also the trend (improving/deteriorating) and even sometimes what we call the 2nd derivative (trend decelerating/accelerating).
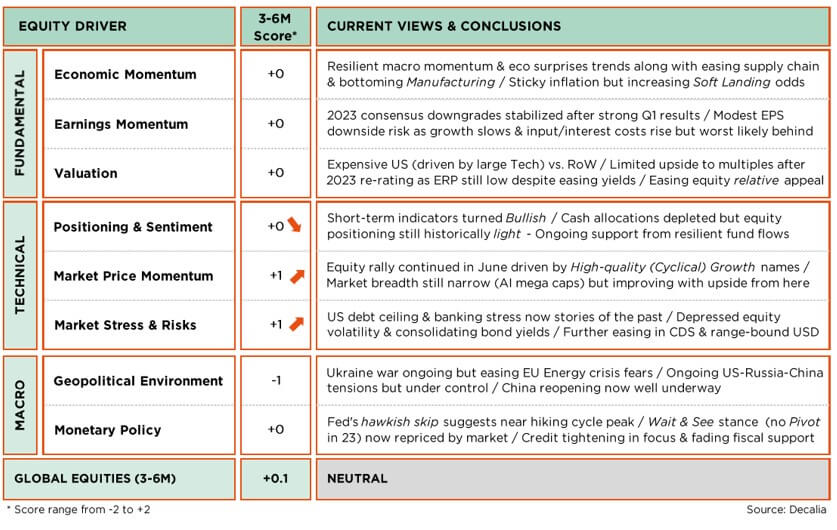
However, business cycle isn’t the only driver of financial markets. Valuations, positioning, sentiment and technical matter too. In other words, it’s key to have a dashboard to check different indicators.
Here is our own example of dashboard for global equity market. Then, you may do the same for different equity markets or sectors (the scores attributed to these variables are obviously different depending on the region or sector).
So, there isn’t unfortunately a magical formula with stable weights to give to all these indicators but, thanks to experience, professional investors tend to have some clues about which ones are more important in certain market conditions or configurations. Furthermore, there is still a qualitative judgement despite we use plenty of quantitative data: how do you define a “good” growth environment or a “severe” inflation issue…
Above 2%, 3%? Are these thresholds the same in US than in Italy? But as I often say to myself in order to remain humble: “An economist is an expert who will know tomorrow why the things he predicted yesterday didn’t happen today.” (Laurence J. Peter), while on the other side I perfectly know that “timing is everything” but impossible over the long term.
So, investors should anyway rely on consistent, robust and extensive investment process -that you always tweak and complement with experience- in order to achieve superior risk-adjusted returns over the long term… even if sometimes you will fail. The key is foremost not to repeat the same mistakes and lastly to use the previous failures to learn from them and improve the process.

FABRIZIO QUIRIGHETTI
CIO, Head of Multi-Asset
Fabrizio Quirighetti and his team supervise $1bn fixed income allocation for DECALIA. Before joining DECALIA, he worked for more than 17 years at Syz Asset Management. He was CIO and Head of Multi-Asset and managed various Fixed Income strategies.
Before that, he spent six years working as a teaching assistant in the Econometrics department at the University of Geneva. Fabrizio Quirighetti holds a Master’s degree in applied econometrics from the University of Geneva.
From 2014 to 2020, he was an external member of the Tactical Allocation Committee of Compenswiss, the AHV/IV/EO social security fund manager.

About DECALIA SA
Established in 2014, DECALIA SA is a Swiss investment management company. With more than 70 employees and assets under management that stand at €4.9 billion, DECALIA has expanded rapidly, in particular thanks to its active-management experience built up over the last 30 years by its founders. The strategies developed by DECALIA focus on four investment themes deemed promising in the long term: the disintermediation of the banking sector, the search for yield, long-term trends and market inefficiencies. DECALIA is regulated by FINMA through a collective assets manager’s license. In addition to its Geneva headquarter, the group has offices in Zurich, Milan & distributors of the DECALIA Sicav in Spain & Germany.
This is a marketing communication issued by DECALIA SA. It is neither directed to, nor intended for distribution or use by, any person or entity who is a citizen or resident of or located in any locality, state, country or jurisdiction where such distribution, publication, availability or use would be contrary to law or regulation. The information and data presented in this document are not to be considered as an offer or invitation to buy or sell any securities or financial instruments nor to subscribe to any services. The information, opinions, estimates, calculations etc. contained in this document reflect a judgment at the original date of publication and are subject to change without notice. Investments in any securities or financial instruments may not be suitable for all recipients and may not be available in all countries. This document has been prepared without taking account of the objectives, financial situation or needs of any particular investor. Before entering into any transaction, investors should consider the suitability of the transaction to individual circumstances and objectives. Any investment or trading or other decision should only be made by the client after a thorough reading of the relevant product term sheet, subscription agreement, information memorandum, prospectus or other offering document relating to the issue of the securities or other financial instruments. Where a document makes reference to a specific research report, the document should not be read in isolation without consulting the full research report, which may be provided upon request.
Unless specifically mentioned, charts are created by DECALIA SA based on FactSet, Bloomberg or Refinitiv data.