
- One graph is worth a thousand words…
- So, here are a few graphs -and several thousand of invisible words- on Japan inflation, which I deem both original and striking enough to not need any additional comments on top of a punchline’s title.
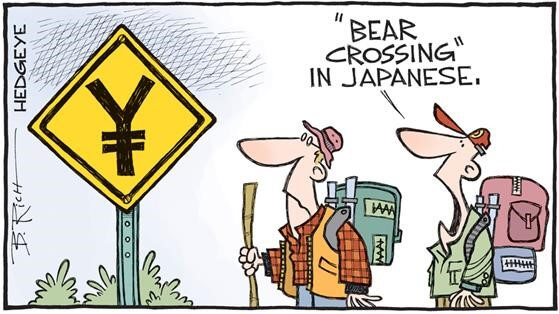
- The weight of words, the shock of image: “What is the BoJ doing!” is the subject at hand
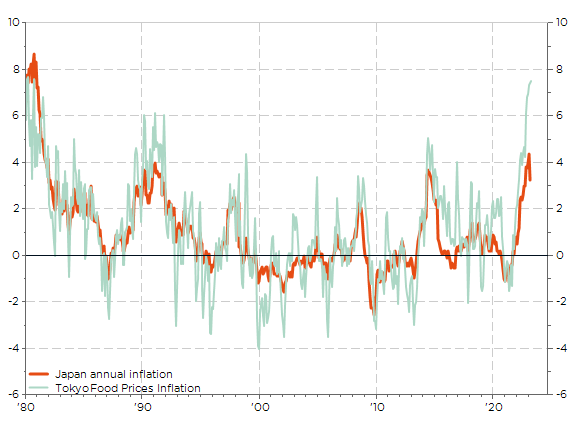
Food for thoughts or spurious correlation?
Japan inflation driven essentially by… food prices in Tokyo
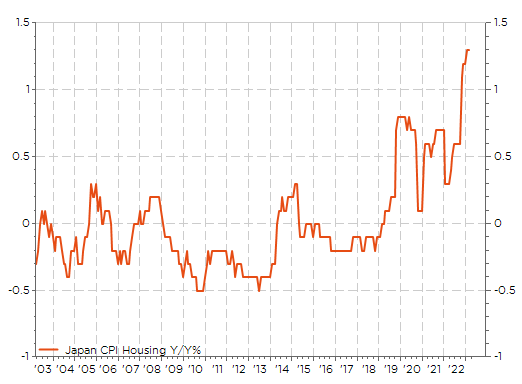
Back from the dead?
Japan CPI Housing Y/Y%
BoJ inflations’ anchor, gone with the wind?
Japan Consumers Inflation Expectations
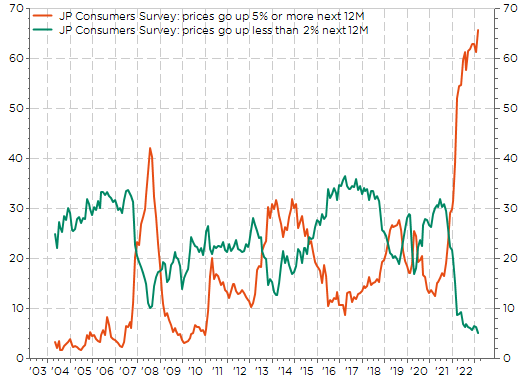
These trends aren’t BoJ friends
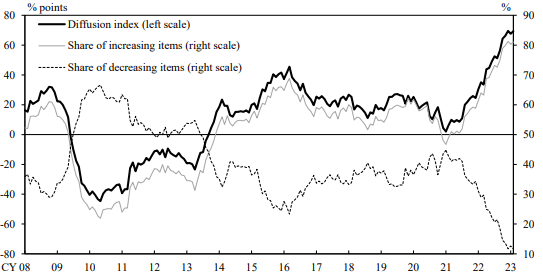
Measures of Underlying Japan Inflation: Trimmed Mean CPI, Weighted Median CPI and Mode CPI
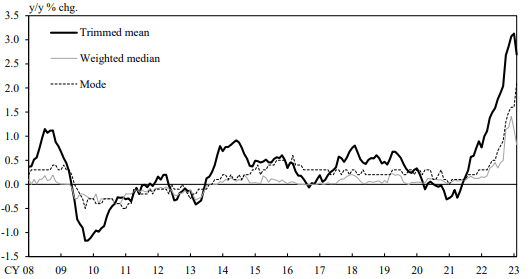
Measures of Underlying Japan Inflation: Diffusion Index (% increasing items – % decreasing itmes)
They (finally) got the (pricing) power?
Input & Output Prices in (Quarterly) Tankan Survey
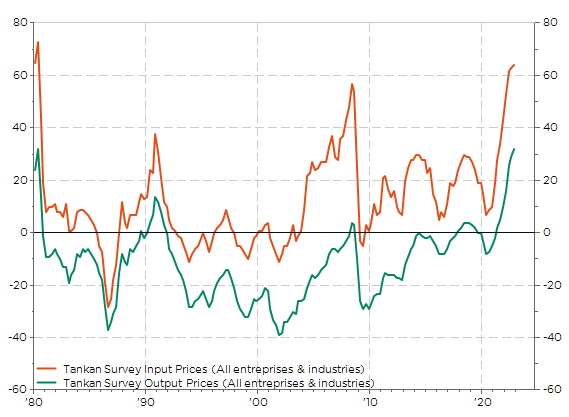
Companies are starting to revise their pricing strategies in response to rising input costs, from raw materials to… wages eventually
Catch me if you can
Japan contractual wages index (Y/Y%) & Japan inflation
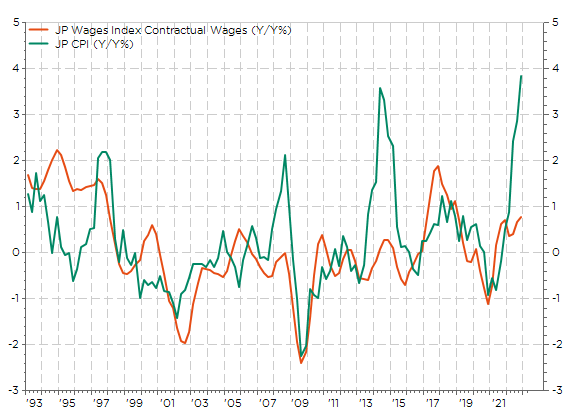
Usually “contractual wages” negotiated each year during the “shunto” spring wage talks track closely inflation… except when the increase in inflation is due to temporary one-off event like the VTA increase back in 2014-2015. This time, it could be different… but what is the BoJ doing!
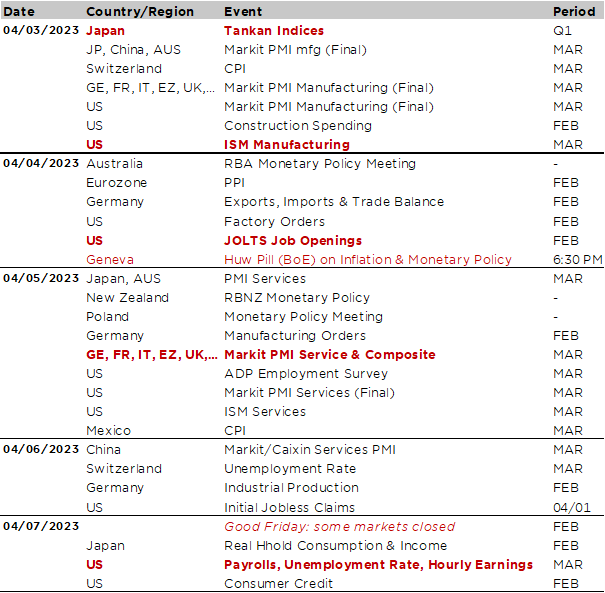
Economic calendar
Goodbye to March Madness… finally, but still watch your back tomorrow for April Fools’ Day and let’s hope that next week Good Friday will really be good! Indeed, the key economic data of next week will be the US jobs report for March, which will be released on Friday. Some investors will have until the following Tuesday (11 April) to chew it and digest it as US stock and bond markets will be closed on Friday, while most European markets won’t be open for Easter’s Monday.
This US jobs report will be the last one before the next Fed meeting at the very beginning of May and it may thus already be decisive… If there are clear evidences of cooling in the US labor market, the Fed may finally opt for a pause in its hiking cycle after an uninterrupted 475bps hike over the last 12 months. In the opposite case (i.e. strong payrolls and/or wages gains, lower unemployment rate), another 25bps hike may be delivered on May 3rd. The consensus expects overall a solid labor report… Nonfarm payrolls gain is expected to slow to +240k after upside surprises in the past two months (+311k in February), hourly average wages growth to increase by +0.3% MoM, which will lead the YoY reading to fall to 4.3% (the lowest since summer 2021) and the unemployment rate to remain unchanged at 3.6%. Median wages growth will also be scrutinized, as well as the participation rate to assess to what extent the Fed’s job is done (or not). Prior that, there will be other US labor market-related indicators to crunch next week, including the ADP report and JOLTS data on Wednesday, the weekly initial jobless claims on Thursday and the US ISM manufacturing and services employment components.
Speaking about the US ISM indices, investors will also focus on them earlier next week. They will be released on Monday (manufacturing) and Wednesday (services). Both the manufacturing and services indices are expected to remain broadly unchanged around 47-48 and 54-55 respectively. The same days, the PMI final March readings for the major economies will also be published. It will be interesting to see if the recent banking turmoil has somewhat weighted on these sentiment indicators, leading to some downward adjustments in the final readings. Anyway, the broad picture of services activity outperforming manufacturing in terms of level and trend should remain quite clear as also indicated in China this morning (PMI services +1.9 to 58.2 vs. -0.7 to 51.9 for manufacturing).
Coupled with the US jobs report and the related labor market indicators, whether the ISM/PMI indices also show robust growth, especially in components like employment and prices, will be key to assess economy’s resilience… and potential ongoing inflationary pressures. To hike or not to hike? Except extraordinary gloomy or upbeat economic data releases, that could be a recurring question until beginning of May
Other noteworthy economic data or events to keep an eye on/your ears wide open
- Japan quarterly Tankan indices (Monday), plenty of data on activity, prices, salary, investment, orders and more, split by industry size and sectors.
- Switzerland March CPI (Monday). It is expected to ease back towards 3% in March from 3.4% in February, but uncertainty is higher than usual, as food prices could surprise to the upside again.
- RBA monetary policy meeting (Tuesday). First to pause? A pause in the hiking cycle has indeed almost been promised by the RBA last month as Australian households leverage and the overall housing market are more at risk there due to the predominance of floating rate mortgages. Moreover, inflation pressures have been as acute than in the US or Europe.
- Last but not the least, Huw Pill (Bank of England), Chief Economist and obviously among the key voting members of the BoE, will give a lecture in Geneva (Maison de la Paix, 2 chemin Eugène Rigot, Auditorium Ivan Pictet) on Tuesday 4th April at 6:30 pm; “Inflation Persistence & Monetary Policy”… a well-chosen & timely topic! Hope to see you there.
This is a marketing communication issued by DECALIA SA. It is neither directed to, nor intended for distribution or use by, any person or entity who is a citizen or resident of or located in any locality, state, country or jurisdiction where such distribution, publication, availability or use would be contrary to law or regulation. The information and data presented in this document are not to be considered as an offer or invitation to buy or sell any securities or financial instruments nor to subscribe to any services. The information, opinions, estimates, calculations etc. contained in this document reflect a judgment at the original date of publication and are subject to change without notice. Investments in any securities or financial instruments may not be suitable for all recipients and may not be available in all countries. This document has been prepared without taking account of the objectives, financial situation or needs of any particular investor. Before entering into any transaction, investors should consider the suitability of the transaction to individual circumstances and objectives. Any investment or trading or other decision should only be made by the client after a thorough reading of the relevant product term sheet, subscription agreement, information memorandum, prospectus or other offering document relating to the issue of the securities or other financial instruments. Where a document makes reference to a specific research report, the document should not be read in isolation without consulting the full research report, which may be provided upon request.
Unless specifically mentioned, charts are created by DECALIA SA based on FactSet, Bloomberg or Refinitiv data.