
A worldwide lockdown, the US capitol attack, war in Ukraine, inflation spiking to high-single digit in developed economies or Bitcoin soaring by 400% since January 2023, etc… we have experienced many events over the last few years that we deemed improbable at best. In the same vein, who would have thought that Cagliari would come so close to winning against Inter and then Juventus? Or that Lausanne Hockey Club would reach the final of the Swiss Hockey Championship this year after nearly being relegated last season? Or that the New York Knicks would play a leading role in the NBA this season? In our day-to-day life, like in sports or in financial markets, (negative as well as positive) black swan events can happen at any time. That’s why it is important to closely observe the markets (as well as our world and your favourite sport’s team obviously), always consider and monitor alternative narratives (especially those deemed improbable by the crowd), and remain very open-minded, as well as humble and nimble. In this context of seemingly impossible outcomes, what if European equity markets outperformed US ones this year?
Of course, the odds seem impossible for the vast majority of investors, who have likely become “accustomed” to the uninterrupted outperformance of US equity markets over the last 20 years. However, for those who are seasoned enough to have been around prior the 2007-2008 GFC and are able to remember this period, European equity markets outperformed US markets in the middle of the 2000’s both in l.c. and especially when converted in USD (EUR/USD strengthened from 0.85 in 2001 to 1.60 in 2008). So, it already happened in the past… And I suspect it may happen again in the next few months -at least in the l.c. terms- and there are a whole host of concomitant reasons for this.
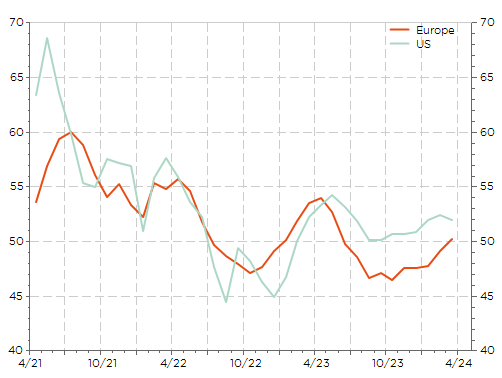
First of all, the European growth outlook is improving as illustrated by the composite PMI index, which has just broken through the 50-threshold separating expansion to contraction territory. While current and potential US growth remains obviously superior to European standards, the trend is clearly in favour of Europe as illustrated in the graph here below.
Europe vs. US composite PMI: Europe catching up
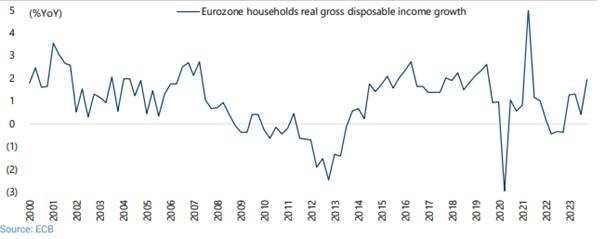
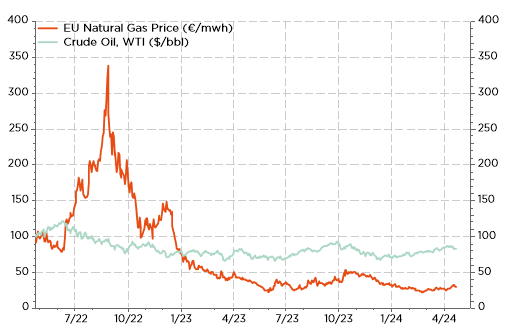
Among the factors explaining this brightening European growth outlook, we may cite the increase in European households’ real disposable income (similar to what happened in the US last year with the decrease in inflation once wages were increased. NB: same will likely happen soon in Japan) due to a large extent to the recent sharp decrease in inflation (read energy prices and specifically natural gas prices).
Eurozone households real gross disposable income growth
Source: Jefferies
European Gas price (€/mwh) vs. WTI Oil price ($/bbl)
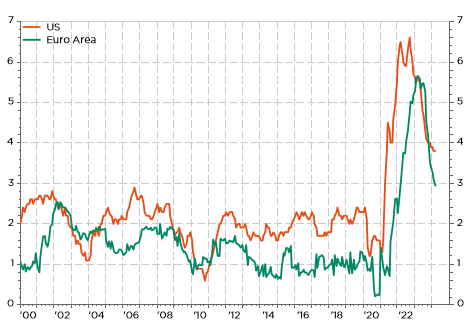
As a result, inflation in the Euro Area is now falling faster -and lower- than in the US, also because demand hasn’t been as robust and buoyant as in the US over the last 18 months. In other words, the bar is lower for the ECB, compared to the US Fed, to embark on policy normalisation. In this scenario, it would likely further improve the growth outlook of the Euro Area by eventually stimulating credit growth (especially for small-and-mid cap companies), as well as revive the housing market through easier mortgage rates/approval conditions. This may also drive the EUR lower (a headwind for European exporters), or at least impede any strong appreciation of the EUR currency this year, as forex trends are driven by rates nowadays.
Europe vs. US inflation: falling later but faster and lower
Speaking of rates, it now also seems that the upside risks on European rates are more contained than in the US, especially in a context where concerns around fiscal dominance are moving to the forefront. This shift comes at a time when both the gross and net supply of US Treasuries are soaring and foreign investors’ appetite is declining…
More attractive valuations are another strong point in favour of European equity markets. While this argument is often used by European-markets perma-aficionados, it is dismissed by many other investors who point to differences in the benchmark composition (namely the low exposure to the fast-growing tech sector) and the overall better earnings growth prospects of US companies compared to the European ones, justifying a valuation premium. An interesting graph here below from GS shows that actually every sector trades at a lower forward multiple in Europe… in a context of improving global growth prospects.
EU vs. US Sector Valuation Opportunities (12M Fwd P/E)

Source: Goldman Sachs
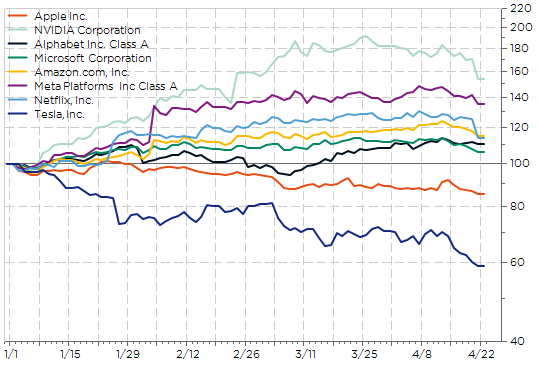
Obviously, the prophecy of European markets outperforming the US going forward can’t factually happen if the US-big tech companies, and especially the Magnificent 7 heavyweights, continue to fly high – regardless of the quality, sensitivity and veracity of the arguments mentioned above. It is worth noting that recent market actions seem to point to some fatique of the Magnificent 7, as illustrated by the disappointing YTD performances of a few of them. Actually, it all/mainly depends on Nvidia this year. At the opposite, financials, especially banks (a large overrepresented and thus key sector in Europe) is still thriving… It’s perhaps no coincidence that the outperformance of European equities in the mid-2000’s happened at a time when the US tech sector/Nasdaq index was struggling, while financials/banks were among the outperformers…
The “Mag7” YTD performances: not all these cylinders driving the S&P500 higher this year.
Let sump up! There is a strong macro tailwind for Europe, backed by: the ECB cutting rates soon (or sooner than the Fed anyway), an improving growth outlook and lower inflation risks than in the US, cheaper valuations, a more solid banking system (as it already went into a consolidation process with more profound reforms than in the US), a less “urgent” need for fiscal consolidation (with more profound reforms than in the US), a less “urgent” need for fiscal consolidation (with more room to maneuver considering the low public debt level in Germany and the current contained peripheral spreads), a single-currency that won’t represent a headwind for European exporters, a better grip to reap the benefits of a growing world economy, and last but not least, a possible pause in the significant outperformance of US big-tech heavyweight names…. With all of this in mind, suddenly the odds of David-like European equity markets beating the US-Goliath suddenly don’t seem so insurmountable. Forza Cagliari! Allez allez LHC!
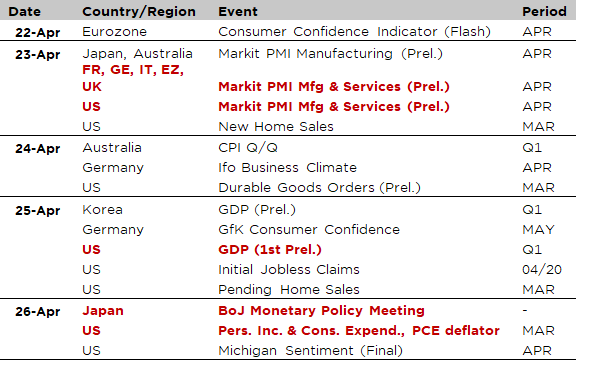
Economic Calendar
What’s about the trends in global growth, US inflation, Japan policy rates or Q1 earnings results? You will soon know more about all these topics as they will be in focus this week. Starting with growth momentum across the major economies, the flash PMI indices for April will be released on Tuesday. Investors will keep a close eye on the European gauges, especially on German manufacturing one, for a confirmation of the improvement in business sentiment in this region. Then, we will get the first estimate of US Q1 GDP on Thursday. The consensus expects growth to have slowed somewhat from +3.4% a.r. in the last quarter of 2023 to circa +2.5% in Q1-2024 (closer to +3.0% according to the Atlanta Fed GDPNow forecast). Focus will be on consumption, as the main and less volatile driver of overall GDP growth, and on fixed investment, to a lesser extent, for future capex trajectory.
Finally, on Friday, the US PCE deflator will be released along with March personal income, expenditure and saving rate. The consensus points to roughly stable figures compared to the prior month with monthly gains of +0.3% for both the core and headline figures, which will lead to yoy readings of +2.7% and +2.6% respectively versus 2.8% and 2.5% in February. As it is the Fed’s favorite inflation gauge, a major upside/downside surprise will likely impact negatively/favorably financial markets. Before that, in the very early morning, the BoJ will likely keep its target rate unchanged at 0.1% with a still overall accommodative stance (inflation is still running well above 2%) but investors expect some guidance about rates trajectory (timing of the next hikes and potential terminal rate) as well as some tweaks about its JGB purchasing program (changes in the guidelines to make them more flexible). In this context, all eyes will be on BoJ inflation and growth projections for this year and next and how the recent strong wage growth filter into them.
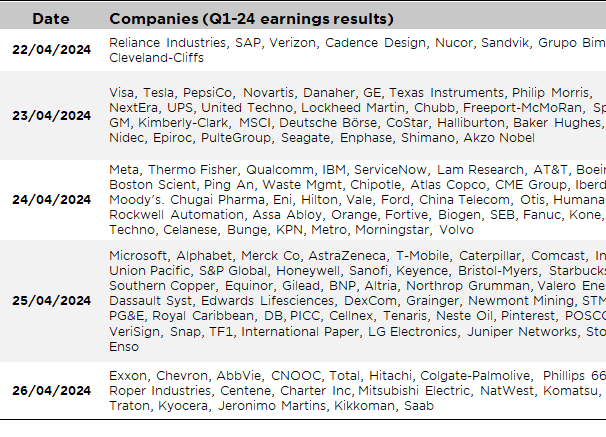
In the meantime, the US earnings season will reach full speed with the earnings releases of Microsoft, Alphabet, Meta among Big-Tech (representing circa 15% of S&P500 market cap together), but also Visa, Tesla, PepsiCo, Merck Co, Exxon or Chevron among the heavyweights. In Europe, this week’s notable companies Q1 results include SAP, Novartis, BASF, Danaher and AstraZeneca.
Non-exhaustive list of major Q1-20224 earnings releases over the week
This is a marketing communication issued by DECALIA SA. It is neither directed to, nor intended for distribution or use by, any person or entity who is a citizen or resident of or located in any locality, state, country or jurisdiction where such distribution, publication, availability or use would be contrary to law or regulation. The information and data presented in this document are not to be considered as an offer or invitation to buy or sell any securities or financial instruments nor to subscribe to any services. The information, opinions, estimates, calculations etc. contained in this document reflect a judgment at the original date of publication and are subject to change without notice. Investments in any securities or financial instruments may not be suitable for all recipients and may not be available in all countries. This document has been prepared without taking account of the objectives, financial situation or needs of any particular investor. Before entering into any transaction, investors should consider the suitability of the transaction to individual circumstances and objectives. Any investment or trading or other decision should only be made by the client after a thorough reading of the relevant product term sheet, subscription agreement, information memorandum, prospectus or other offering document relating to the issue of the securities or other financial instruments. Where a document makes reference to a specific research report, the document should not be read in isolation without consulting the full research report, which may be provided upon request.
Unless specifically mentioned, charts are created by DECALIA SA based on FactSet, Bloomberg or Refinitiv data.