
It is not only on the geopolitical front, with Iran, Venezuela or Greenland issues; or in the US domestic political arena with Trump’s incessant statements, threats and gyrations on Fed’s independence -among many others-; or on the US stock market, with the uninterrupted YTD outperformance of small caps and the underperformance of the Mag7, that the established order is currently being challenged… The latest example? Italian soccer, with Cagliari Calcio’s stunning and unexpected 1-0 victory over Juventus this weekend (with only 22% possession, 3 shots against 21, 4 touches in the opponent’s box against 40, and 1 corner against 18). As a result, the new year began much like 2025: with noise, fury and… positive markets performances.
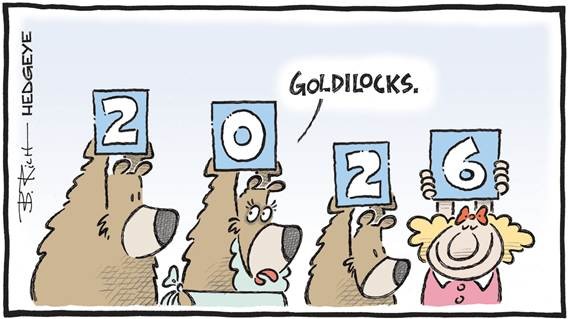
The main reason behind these exceptional markets’ performances despite all these geopolitical turbulence and confusion? A supportive macro backdrop of resilient US & global economic growth, which translated into solid earnings growth, ongoing disinflation leading to central banks easing (or at least no rate hikes in sight -except for the BoJ-) and lower energy prices to help cement this Goldilocks’ scenario. After more than two months of lack of US economic data due to the US government shutdown, we could almost have forgotten to mention macro but with the recent resumption of economic releases, the backdrop remains very supportive. Here is a quick but quite exhaustive overview, essentially through graphs, of the latest releases.
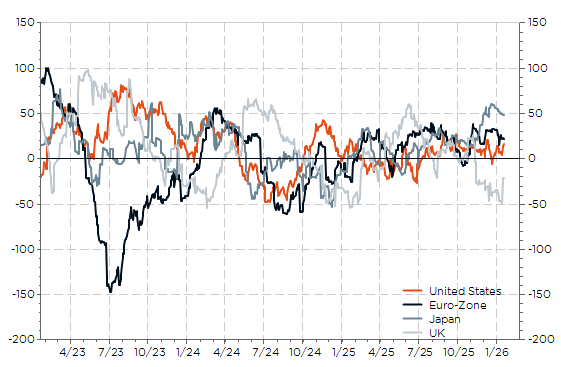
First of all, economic surprises remained positive in most DM economies (except for the UK where a slowdown was due and expected).
Citi economic surprises in developed economies
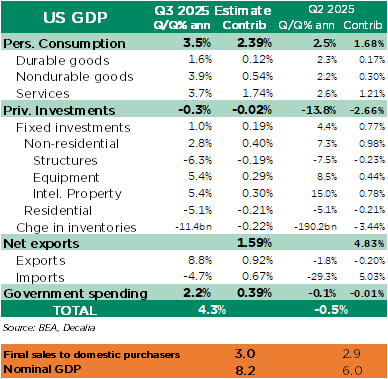
US Q3 GDP surged +4.3% a.r. in Q3, on the back of more solid than expected consumers spending, while net exports and government spending contributed positively too (+1.6% and +0.4% respectively). Investment was basically flat (growth in equipment & intellectual properties offset by weakness in residential and structures) but change in inventories wasn’t a drag this time.
US Q3 GDP (1st estimate) breakdown
Figures are even more impressive in current dollars as nominal GDP soared +8.2% a.r. in Q3 after +6.0% in Q2.
US real and nominal GDP (rebased at 100 in 2010)
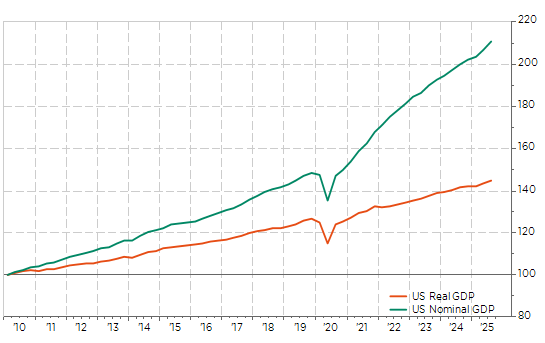
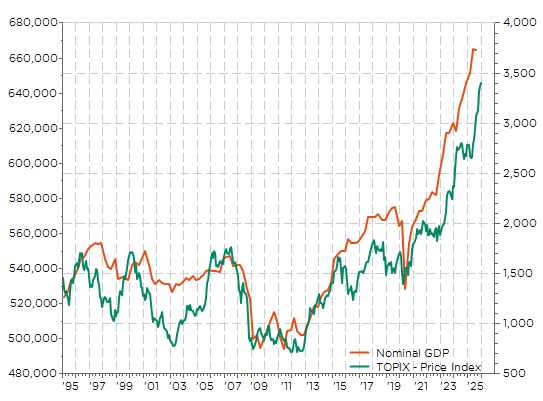
From 2010 to 2020, US real and nominal GDP increased by +25% and +47% respectively. From the end of 2020 to Q3-2025 (i.e. less than 5y), US real and nominal GDP increased by +16% and… +40% respectively. So, over the last 5y, US nominal GDP rose almost as much as the previous decade. As I have said several times in the past, nominal GDP matters for equities markets as earnings and performances are reported in current dollars. The best example could be found by superposing on the same graph the Japan nominal GDP and the Japan equity market over the last 30 years…
Japan’s nominal GDP (JPY trillion) and TOPIX
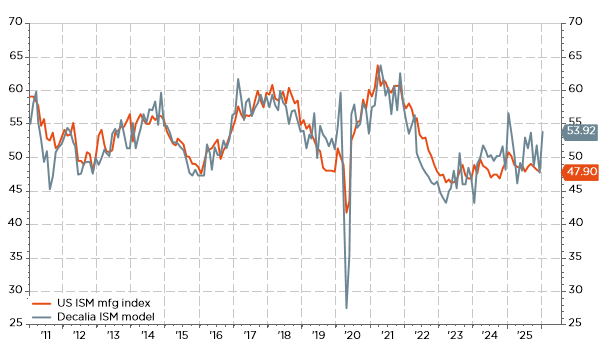
US November retail sales (+0.6% and +0.4% excluding auto and gas) and industrial production (+0.4%) came slightly above expectations, ISM services unexpectedly rose in December to 54.4 (above all 45 estimates in Bloomberg consensus), hitting a 14 months’ high; whereas the prices paid component dipped to its lowest reading since March. Looking more closely to the present days, the January regional manufacturing indices, namely the Empire and the Philadelphia Fed ones, also surprised on the upside, pointing towards a rebound of the ISM manufacturing index this month (data will be released on Feb. 2nd), which thus bodes well for current industrial production activity.
Our US ISM mfg model points to a rebound above 50 in January
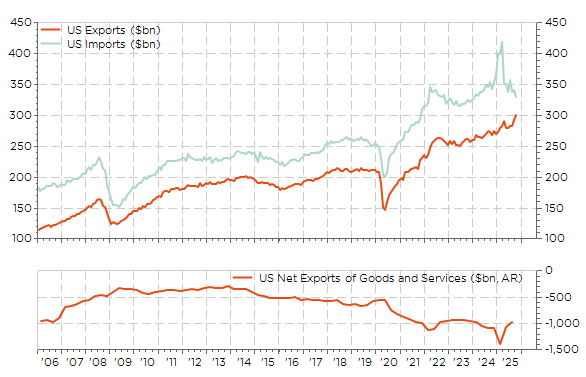
US exports rose in October, while US imports declined, leading to the narrowest US monthly trade deficit (29.4bn) since … 2009! As trade deficit narrows, the usual drag on US GDP growth from the net exports (X-M) may turn into a positive contributor! Or a lesser drag at least.
US exports and imports ($bn, monthly data) and US net exports ($bn, quarterly, a.r.)
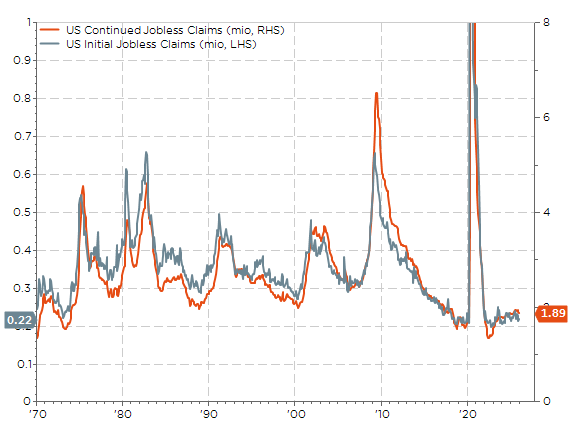
Despite somewhat disappointing US payrolls data, which grew just +50k in December (vs. +70k expected) on top of being subject of a net downward revision of -76k for the 2 prior months, the overall picture remains satisfactory as (1) unemployment rate dropped back to 4.4% (the collapse in immigration means that it suffices of about current payrolls growth to stabilize the US unemployment rate around 4.5%), (2) ISM employment sub-components improved in December and (3) jobless claims remain historically low and have even somewhat declined again recently. So, the US labor market situation remains unusually weird as companies aren’t neither hiring or firing, but we concede that risks are obviously more tilted towards a deterioration as we are late in the cycle.
US initial (LHS) and continued (RHS) jobless claims in million
Even Q4 US big banks results main takeaways were constructive as they showed no deterioration in credit quality, they confirmed the consumer spending was still solid, they observed loans growth was picking-up and headed towards an increase of their operating leverage by bringing down their capital ratio, also helped by incoming deregulation.
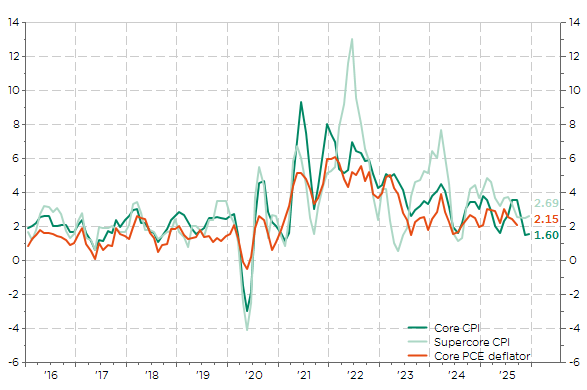
Moving to US inflation, the latest CPI report -for December- was also reassuring as it came slightly below expectations. As a result, the yoy figures (2.7% and 2.6% for the headline and core index respectively) continue to gradually trend lower towards the 2% Fed’s target, while the Q/Q percentage change in annualized rate of key Fed’s prices pressure gauges have already come closer to the 2% target.
Q/Q% a.r. in core inflation, supercore & core PCE: almost there!
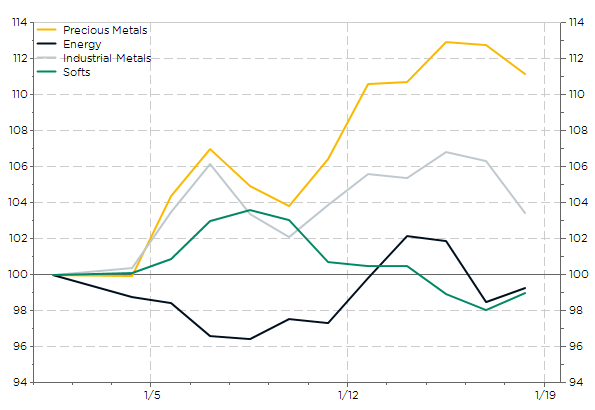
Finally, overall energy prices have been volatile lately -for obvious reasons-, but topsy-turvy and going nowhere finally since the beginning of the year. In other words, they haven’t disrupted the favorable macro backdrop depicted here above. At the opposite, precious metals have benefitted, once again, from these geopolitical tensions and uncertainties.
Bloomberg commodity group indices, spot prices in USD
After last year stunning performances, it may be tempting to anticipate a pause on the equity market, especially as the consensus remains surprisingly optimistic for 2026. However the global economy is not slowing down, the US labor market is showing some signs of fatigue, but is not collapsing. Corporate earnings remain strong, supported by massive investments in AI and continued expansionary fiscal policies. For sure, risks do exist even beyond Trump, geopolitics or Fed independence. AI accounts for a significant portion of hopes and valuations: if the promise is slow to translate into tangible profits, the disappointment could be severe. Inflation, which remains above central bank targets, also limits their room for maneuver. Finally, and perhaps most subtly, the consensus itself has become a risk: pessimists are few and far between, and even the most skeptical struggle to identify an immediate trigger for a major reversal. While it is sometimes a good idea to be bullish when everybody is bearish, the opposite is (fortunately) not necessarily true…
All that reminds us of a truth that markets like to teach us regularly: they rarely move as expected.
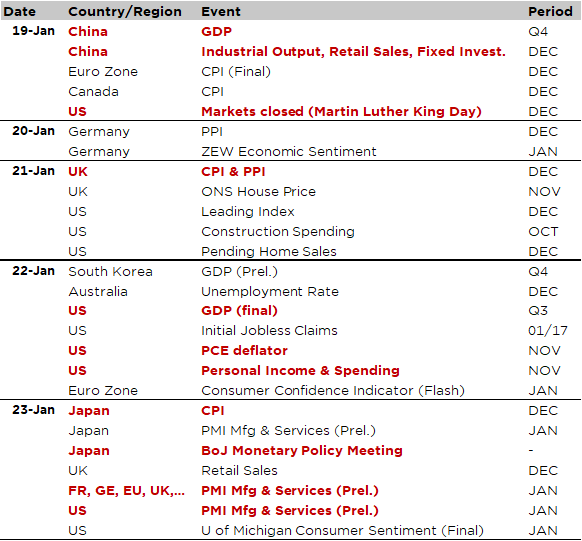
Economic Calendar
In addition of the economic calendar and the earnings results released this week, I should perhaps also add the Trump’s own agenda. Unfortunately, he hasn’t provided yet it to me and I am not even sure he really follows it precisely. Anyway, politics and geopolitics will remain at the forefront in the coming days, especially as the focus will be on the WEF annual meeting in Davos over the week, where US President Trump is scheduled to give a special address on Wednesday. The organizers have a great sense of humor as the theme this year is “A Spirit of Dialogue”. To stay in this theme, but without irony this time, note that the US markets will be closed today for Martin Luther King Day.
Greenland will be top of mind as well as President Trump threatened during the week-end eight European countries -sustaining & supporting Denmark- of an additional 10% tariff on February 1st (increasing to 25% in June) unless and until “a deal is reached for the complete and total purchase of Greenland”.
As far as economic data are concerned, the highlights will include inflation gauges in the US (November PCE deflator on Thursday), UK (December CPI on Wednesday), Japan (Friday) and Canada (Monday); as well as activity indicators with a global health check coming from the January flash PMIs from the major economies (Friday), the final readings of US Q3 GDP (Thursday) and China Q4 GDP, which was released this morning. Without much surprise, the full year result (5.0% in 2025) was perfectly in line with the government target of “around 5.0%”, but we may suspect that these “official” figures overstate somewhat the reality. In details, thanks to the December activity data released at the same time, resilient exports remain the main bright spot supporting the output growth, while retail sales just “grew” +0.9% last year, fixed asset investment declined -3.8% and housing activity remains desperately weak (property investment and residential property sales were down -17.2% and -13.0% respectively last year).
In monetary policy, the main event will be the BoJ decision on Friday (no change expected), which will be closely scrutinized in the current context of ongoing fresh multi-decade highs of 10y JGB yield (currently at 2.25%) on the back of fiscal fears and election fever.
Wrapping up with corporate earnings, highlights for next week include Netflix, J&J, P&G, GE and Intel.
Non-exhaustive list of major earnings releases over the week (market cap > $100bn)
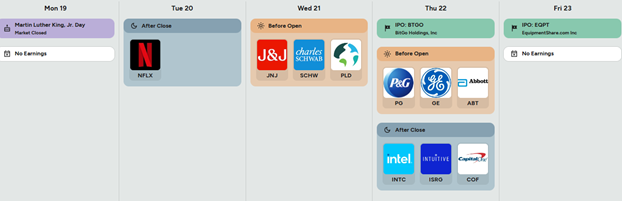
Source: https://earningshub.com/earnings-calendar/week-of/2026-01-19
This is a marketing communication issued by DECALIA SA. It is neither directed to, nor intended for distribution or use by, any person or entity who is a citizen or resident of or located in any locality, state, country or jurisdiction where such distribution, publication, availability or use would be contrary to law or regulation. The information and data presented in this document are not to be considered as an offer or invitation to buy or sell any securities or financial instruments nor to subscribe to any services. The information, opinions, estimates, calculations etc. contained in this document reflect a judgment at the original date of publication and are subject to change without notice. Investments in any securities or financial instruments may not be suitable for all recipients and may not be available in all countries. This document has been prepared without taking account of the objectives, financial situation or needs of any particular investor. Before entering into any transaction, investors should consider the suitability of the transaction to individual circumstances and objectives. Any investment or trading or other decision should only be made by the client after a thorough reading of the relevant product term sheet, subscription agreement, information memorandum, prospectus or other offering document relating to the issue of the securities or other financial instruments. Where a document makes reference to a specific research report, the document should not be read in isolation without consulting the full research report, which may be provided upon request.