
Last week, in Sticky Rates Despite Slippery Growth, we flagged a puzzle: US data was turning noticeably gentler (weak July payrolls print, in-line and reassuring CPI, and a surprise drop in July retail sales), yet the 10y Treasury yield refused to budge from its highs. If anything, the picture has grown more stubborn since. The latest 10y and 30y auctions priced at the highest yields since 2007 and 2001 respectively, and even after the Treasury doubled down on long-bond buybacks to cap the move, yields near +4.7% (10y) and above +5.3% (30y) remain a world away from the sub-+1% levels of March-December 2020.
If cycles are meant to turn, investors could do worse than take a lesson from Italy’s national football team. Four World Cup titles between 1934 and 2006 built one of the most storied cycles in the sport. Since then, the Azzurri have missed three World Cups running (2018, 2022 and 2026) – a cycle that has simply refused to turn back on schedule. They are not alone in testing the patience of statisticians: German fans have watched their multiple-champions crash out in the group stage in both 2018 and 2022, Brazilian fans still wince at a 7-1 semi-final collapse in 2014, and English fans have spent 60 years (and still counting) insisting that « it’s coming home », a hypothesis still awaiting its first piece of supporting evidence. It is a useful, if mildly painful, reminder that history’s cycles do not come with a guaranteed return ticket. Bond investors betting on a swift reversion to lower yields might want to keep that in mind.
Cycles within cycles
The bond market’s own cycles have historically been kinder than Italian football, at least in their regularity. Since the end of the Civil War, US long-term yields have alternated between rising and falling phases lasting roughly a generation each, according to the historians Homer and Sylla (“A History of Interest Rates”): falling from 1870 to 1899, rising from 1899 to 1920, falling from 1920 to 1946, rising from 1946 to 1981, and falling for nearly 40 years until 2020.
A new rising phase appears to have started since.
The scale of these swings is striking. The 30y Treasury yielded about +15% in 1981; by March 2020, the same maturity yielded as low as 1%. No single factor explains a move of this length. Inflation, geopolitics, central-bank policy, credit risk and the demand for income all play a part, but it is really the interplay between facts and investor perception that sets the market’s course. History offers an instructive parallel from just over a century ago: US inflation running below +2% a year still felt intolerable to a population conditioned by a generation of stable or falling prices, prompting President Howard Taft (from 1909 to 1913) to convene an international conference on the « high cost of living » and economist Irving Fisher to propose a « compensated dollar » whose gold value would float with prices. That plan went nowhere; instead, the WW1 double-digit inflation reshaped the monetary order and cemented the young Federal Reserve’s role. A second episode of administered rates followed WW2: from 1942 to 1951, the Fed capped long yields at 2.5%, until the Treasury-Fed Accord of March 1951 restored free price discovery in the bond market… opening the door to the 1946-1981 bear market.
What is keeping today’s yields anchored high
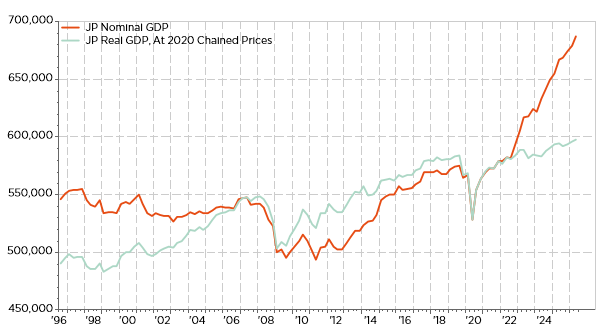
Three structural forces look particularly relevant to the current episode. The first is a familiar rule of thumb among rates watchers: when trend nominal GDP growth runs persistently above the 10y yield, it tends to be a signal that yields have room to rise, since the return generated by the economy is outrunning the government’s own cost of long-term borrowing. US trend nominal GDP growth has been running near 6% YoY over the past three years, comfortably above the +4.7% 10y. The same tension shows up in Japan, where nominal GDP growth has held in around 3%-5% range for the last 2 years, still running above a 10y JGB yield that itself just touched a 30-year high near 3% (Japan nominal growth was running at 4.8% a.r. in Q2 according to the latest Japan GDP report), one reason investors are pricing further BoJ hikes into next year.
Japan real and nominal GDP (JPY bn): from deflation to above 2% inflation
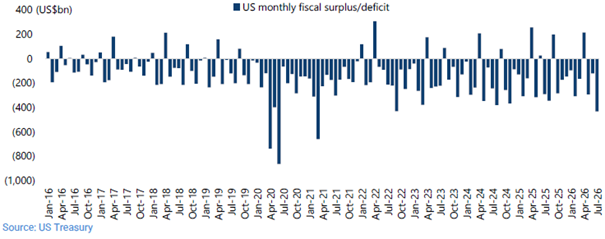
The second is the state of US public finances. According to Jefferies, the federal deficit widened to about $432bn in July (a record for that month and the worst monthly print since March 2021), leaving the ten-month fiscal-year deficit close to $1.8tn, already above the full year 2025 deficit. Net interest plus entitlement spending now absorbs close to 100% of federal receipts, and total public debt has just crossed $40tn. The Treasury’s response bears a family resemblance to the « Operation Twist » playbook: with Treasury bills now covering roughly 85% of gross issuance to keep short-term funding costs “somewhat” down, the Treasury just announced it would double the size of its long-bond buyback operations, to at least USD 4bn per operation, in an effort to keep a (plaster) lid on the long end.
US monthly fiscal balance ($bn): a clear deterioration since Covid, which now seems to be the rule
US net interest and entitlements as % of total federal government receipts (annualized)
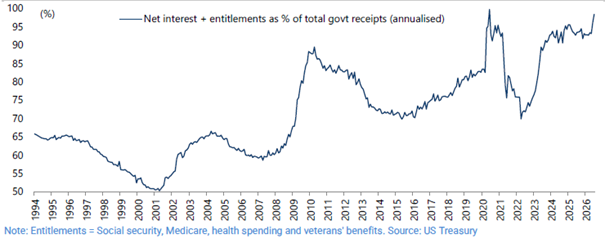
Source: Jefferies, Greed & Fear 20 August 2026
The third is the external position. The US net international investment position, i.e. the gap between what Americans own abroad and what foreigners own onshore, has swung from a deficit of about $7.8tn (40% of GDP) in 2017 to roughly $21.3 Tn (+68% of GDP) in the first quarter of 2026, after peaking above +75% in 2024 (before the US dollar got weaker last year…). Japan sits at the opposite extreme, with a net creditor position that has grown from around +58% of GDP in 2017 to roughly +83% of GDP today. Japanese investors remain the largest foreign holders of Treasuries, at about $1.1tn, but that stake is down from a February peak of $1.2tn. A gradual repatriation that, if it accelerates as JGB yields keep climbing, would add further upward pressure on US term premia… explaining why US Treasury Secretary is concerned about the fate of JPY and JGB’s yields.
The Böhm-Bawerk test and Switzerland’s answer
A thread runs through all of this: confidence in the sovereign issuer’s own signature counts for as much as any single macro release. As I like to often repeat the word « credit » comes from the Latin word “credere”, meaning « to believe », « to trust » or « to entrust ». Over a century ago, the Austrian economist Eugen von Böhm-Bawerk argued that a nation’s level of interest rates mirrors its financial strength, its institutional discipline and, in his words, its cultural maturity (“the cultural level of a nation is mirrored by its rate of interest: the higher a people’s intelligence and moral strength, the lower the rate of interest”). Applied today, the debates around the durability of US public finances and the independence of its institutions sit squarely within that same tradition: the question of whether sovereign credit should carry a premium tied to governance quality, above and beyond the standard macro aggregates.
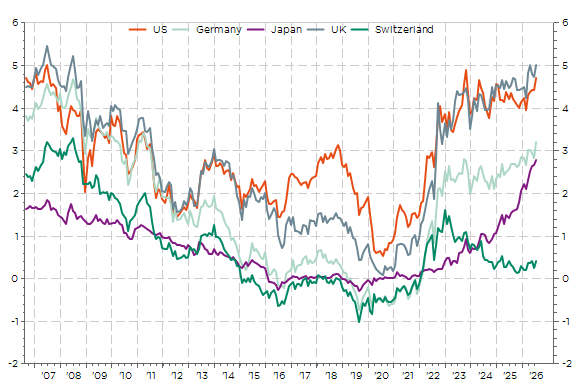
Switzerland offers a useful mirror image. Its 10y government bond yields sit at +0.36% as I type, among the lowest in the world, alongside a policy rate still at 0%. Behind that stands a net international investment position of roughly +120% of GDP (or close to CHF 1tn as of Q1 2026, according to the SNB), a persistent current account surplus, federal debt trending down toward one third of GDP on the back of Switzerland’s debt brake, and a AAA rating that has never been in question. If interest rates are, per Böhm-Bawerk, a mirror of a nation’s financial and institutional strength, the franc’s minuscule long yields, as well as the ongoing structural strength of the Swiss Franc, are as clean a reading of that mirror of diverging trends (or fortunes, which also depend of political leaders intrinsic qualities) as markets currently offer.
Selected 10y government bond’s yield
Where this leaves us
If the current bear market in bonds, under way since 2021, were to rhyme with the 1946-1981 episode, it could in theory run into the middle of this century. Nothing is preordained, but history’s analogy, and, above all, the weight of the structural forces argues for now, for a « higher for longer » regime in US yields.
I will leave it to Italian football fans, like me, to hope their own cycle turns before then.
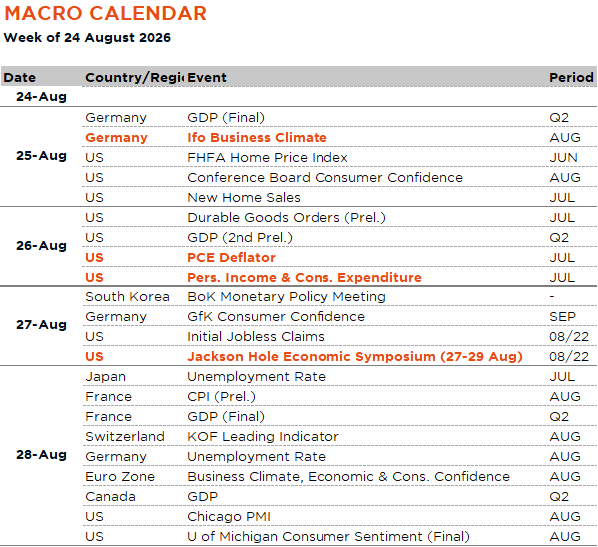
Economic Calendar
In theory, this week should be a relatively quiet one for markets, at least as far as the macro calendar is concerned. But after the week we just had -where an unexpected comment from Scott Bessent on Treasury buybacks was enough to send yields swinging, the dollar sliding and both gold and bitcoin soaring – the “unknown unknowns” increasingly look like the rule rather than the exception this year. So, betting my bottom dollar and declaring this week will be a light one would probably be asking for trouble.
Beyond the return of Italian Serie A soccer championship, for those with their priorities straight, with Cagliari kicking off the season with a well-deserved 1-0 victory against Parma last Saturday; investors will be keeping a close eye over the next few days on :
- The US PCE deflator for July (Wednesday), alongside personal income, spending and saving rate. The economists’ consensus expects core PCE to rise by +0.2% MoM, and remain unchanged at 3.3% on a YoY basis. They also see consumption growth slowing, after a strong Q2, to in both nominal and real terms.
- The Jackson Hole economic symposium starting next Thursday until Saturday 29. The theme this year is “Financial Innovation: Implications for Payments and Policy« . Not the most inspiring or topical issues, but investors will nevertheless be focused on the speech by Fed Chair Warsh on Friday.
- Other tier-2 US economic indicators including the Conference Board’s consumer confidence index and July new home sales on Tuesday, as well as the July durable goods orders (Wednesday), which remains a good proxy of capex when stripping out the transportation and defense components.
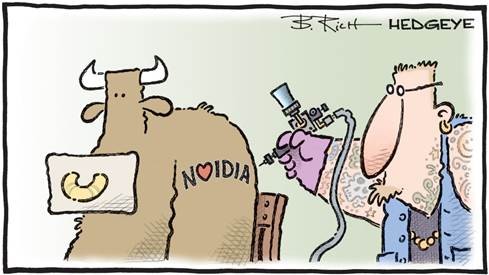
In Europe, the main economic releases will be the German IFO on Tuesday and France flash CPI print for August. Last but not the least, concluding with corporate earnings, the spotlight will be on Nvidia results on Wednesday… The “One chip to rule them all (in the AI kingdom)!”. Other US mega tech companies reporting this week include CrowdStrike, Salesforce and Marvell.
This is a marketing communication issued by DECALIA SA. It is neither directed to, nor intended for distribution or use by, any person or entity who is a citizen or resident of or located in any locality, state, country or jurisdiction where such distribution, publication, availability or use would be contrary to law or regulation. The information and data presented in this document are not to be considered as an offer or invitation to buy or sell any securities or financial instruments nor to subscribe to any services. The information, opinions, estimates, calculations etc. contained in this document reflect a judgment at the original date of publication and are subject to change without notice. Investments in any securities or financial instruments may not be suitable for all recipients and may not be available in all countries. This document has been prepared without taking account of the objectives, financial situation or needs of any particular investor. Before entering into any transaction, investors should consider the suitability of the transaction to individual circumstances and objectives. Any investment or trading or other decision should only be made by the client after a thorough reading of the relevant product term sheet, subscription agreement, information memorandum, prospectus or other offering document relating to the issue of the securities or other financial instruments. Where a document makes reference to a specific research report, the document should not be read in isolation without consulting the full research report, which may be provided upon request.